
When a car hits a pothole, the suspension system can take on major damage in a matter of seconds. Suspension systems must be able to adapt to myriad road conditions while supporting the wheels, seats, and body of the car. To study the performance of a vehicle suspension system, you can use multibody analyses and a simplified lumped model of a mechanical system.
Paving the Way for Innovative Vehicle Suspension Systems
What if there was a bright side to hitting a pothole? Innovations in vehicle suspension technology could make this possible. Potential developments include a method for converting kinetic energy into electrical energy to power vehicles, software-driven shocks that can mitigate potholes, and mechanical suspension settings that adjust with voice commands.
Enhanced suspension systems are not possible without first developing a strong foundation. The suspension system in any vehicle, after all, needs to adapt to load variations, absorb dips and bumps in the road, and more. If not, common suspension problems arise, such as poor wheel alignment, wearing springs, and damaged dampers.
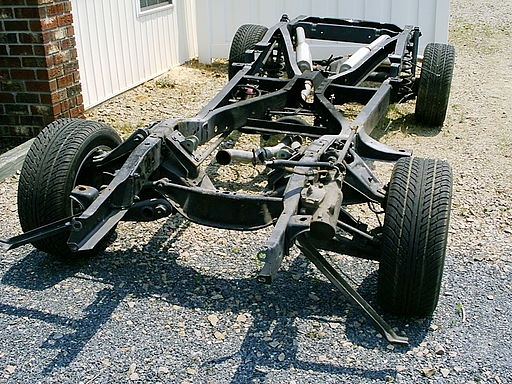
An example of a chassis with a suspension system. Image by Christopher Ziemnowicz — Own work. Licensed under CC BY-SA 2.5, via Wikimedia Commons.
By setting up a simplified lumped model in the COMSOL Multiphysics® software, you can analyze and optimize vehicle suspension system designs.
Modeling a Lumped Mechanical System in COMSOL Multiphysics®
Available as of version 5.3a of COMSOL Multiphysics®, the Lumped Mechanical System interface can be used for modeling discrete mechanical systems in a nongraphical format. This can be in terms of masses, dampers, and springs. You have the option of connecting these systems to a 2D or 3D Multibody Dynamics interface. When modeling a lumped mechanical system, you can use both the Lumped Mechanical System and Multibody Dynamics interfaces within the Multibody Dynamics Module.
In this tutorial, the lumped model of the vehicle suspension system has three main components:
- Wheels
- Seats
- Body
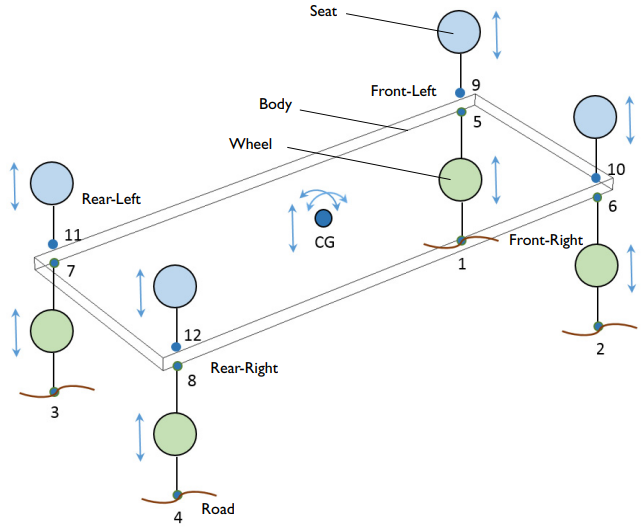
The lumped model of a vehicle suspension system with three main components.
Each wheel has one degree of freedom (DOF) and is represented by a green circle in the image above. Each seat is represented by a blue circle and also has one DOF. At the center of gravity, the body has three DOFs that account for the system’s rotation:
- Roll
- Pitch
- Heave
You can use a Rigid Domain node and Prescribed Displacement/Rotation subnode in the Multibody Dynamics interface to restrict the number of DOFs for the body.
To model the wheel and seat, you use the Mass, Spring, and Damper nodes within the Lumped Mechanical System interface. The full vehicle model includes all four wheels and four seats, and both components are defined as a subsystem.
In the schematic below, the mass (m), spring (k), and damper (c) are shown. The lumped model of the wheel accounts for its mass and stiffness, as well as the stiffness and damping of the vehicle suspension. The lumped model of the seat accounts for its stiffness and damping, as well as the mass of the passenger.
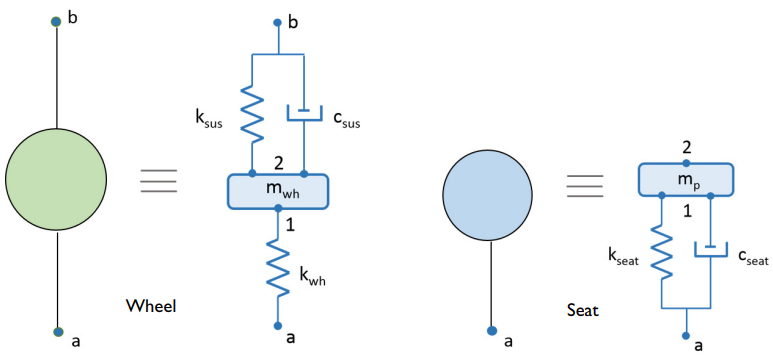
The lumped model of a wheel and seat.
The Lumped Mechanical System interface enables you to model the vehicle body as an External Source in the lumped mechanical system. This helps to connect the suspension system with the vehicle body at the wheel-body and body-seat points.
Editor’s note on 12/13/22: In version 6.1, the Rigid Domain feature has been renamed to Rigid Material.
Examining the Transient Analysis Results
Through a transient analysis, you can compute both the vehicle motion and seat vibration levels for a given road profile. In this scenario, the bump height for the road is 4 cm and the width is 7.5 cm. The vehicle is assumed to be moving with a constant speed of 40 km/h. The road profile is modeled by assuming a series of bumps on the road, but only the left wheels of the vehicle are assumed to be moving over the bumps.
Let’s take a look at the time history of the vehicle’s roll, pitch, and heave. These results could be useful for designing shocks that intuitively reduce the amount of roll, pitch, and heave after hitting a pothole.
As shown below, the roll rotation is larger than the pitch rotation for the given road excitation as the left side of the vehicle is moving over the bumps given in the road profile. You can also see the corresponding velocities for the roll, pitch, and heave motions in the velocity plot below on the right. Two different frequencies — low and high — correspond to the natural frequencies for the components of the system.


Vehicle roll, pitch, and heave motions at the center of gravity (left) and corresponding vehicle velocities (right).
If you want to harness the kinetic energy induced by hitting a pothole, for example, you need to determine how the vehicle moves and the rate at which it moves. In this case, you can analyze the time history of displacement and acceleration at all four seat locations. The seat displacement results show that the left side of the vehicle has a much larger displacement because this side goes over the bumps in the road, whereas the right side does not.


Time history of seat displacements (left) and seat accelerations (right).
Finally, to determine how soft or hard the suspension is and modify it accordingly, we want to find out what the forces are in the springs. The results show that the force magnitude in the spring and damper of a wheel is much larger than that of a seat. This is because the force is absorbed by the inertia of the wheels and the vehicle body, so only a fraction of the force is transmitted from the wheel to the seat. Additionally, the frequency of vibration is much lower for the forces in the seat compared to the forces in the wheel — making for a smoother ride.


Forces in the springs and damper of the front-left wheel (left) and front-left seat (right).
Next Steps
This simplified model provides a solid foundation for analyzing vehicle suspension, which you can then compare to data from experiments. With verified results, you can enhance suspension system designs for real-world performance.
Try the Lumped Model of a Vehicle Suspension System tutorial yourself via the button above.


Comments (1)
Pavan Kumar
August 29, 2020What does -lms.E1_f1 in the applied force subnode mean ? What is it ?Can you describe how that became a force value