
Pulmonary artery stenosis (PAS) is a condition in which the narrowing of the pulmonary artery increases pressure and puts strain on the heart. In addition to traditional imaging methods like CT and MRI, computational simulations can provide valuable insights into blood flow dynamics. In this blog post, we will show how blood flow through a stenosed pulmonary artery can be modeled by treating the stenosis as a porous medium. This approach can help researchers to better understand how artery narrowing affects blood flow. In the long run, it may also support doctors in assessing the severity of a stenosis and deciding whether further examination or treatment is needed.
Stenosis and Blood Flow Characteristics
Medical imaging techniques such as ultrasound, CT, and MRI provide valuable, patient-specific insights into pulmonary artery stenosis by visualizing the anatomical structure. They can also measure flow characteristics like velocity and flow direction, for example, using the Doppler effect in ultrasound. Computational simulations complement these methods by providing a detailed view of dynamic pressure, velocity, and stresses throughout the entire vessel. By combining both methods, clinicians and researchers gain deeper insights that can improve diagnosis and treatment plans.
A stenosis is a narrowing of a blood vessel that restricts blood flow, often caused by plaque buildup. This narrowing leads to turbulence and increased pressure. To better understand these effects, researchers in hemodynamics use mathematical models to describe the shape of a stenosis and analyze how its geometry, location, and blood properties influence flow and pressure.
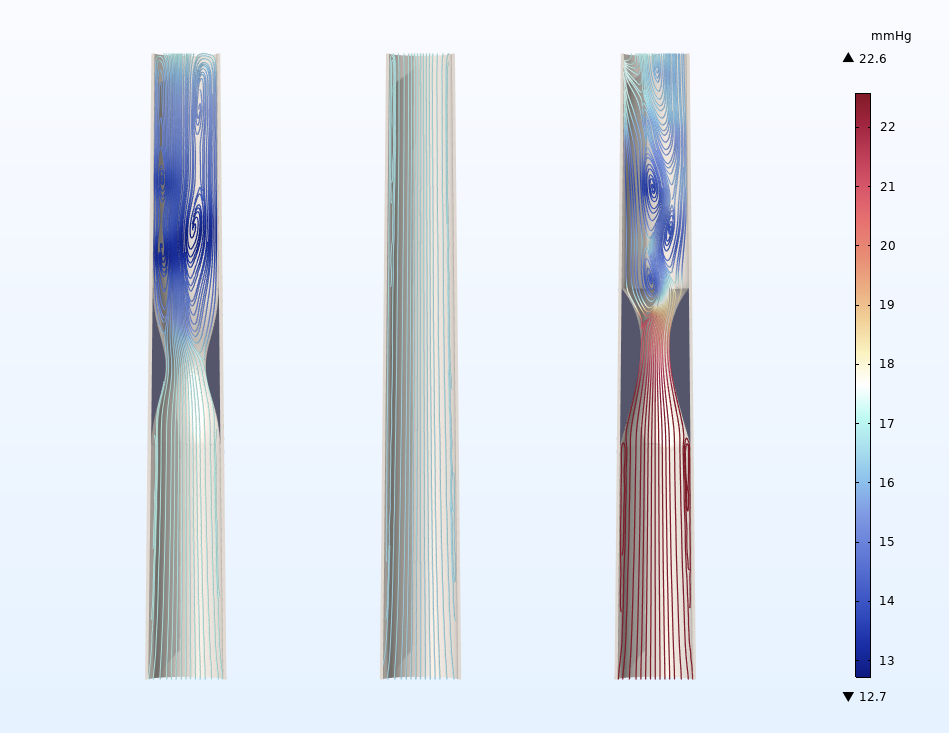 Flow field in an idealized artery with (from left to right) a mild bell-shaped stenosis, a healthy section, and a severe asymmetric stenosis. Streamlines show turbulence caused by the narrowing, while the color indicates pressure levels — showing a significant pressure increase in the stenosed cases.
Blood is a non-Newtonian fluid, meaning its viscosity changes with flow conditions. This behavior is influenced by the shear rate and the number of red blood cells (hematocrit). Different models describe this behavior:
- Carreau model — commonly used for arterial blood flow, capturing shear-thinning effects where viscosity decreases with increasing shear rate
- Casson model — useful for low-shear conditions, such as capillary flow, where red blood cells tend to accumulate (rouleaux), which increases viscosity
- Herschel-Bulkley model — considers yield stress, relevant in high-hematocrit conditions where blood resists flow until passing a threshold value
For large vessels like the pulmonary artery, the Carreau model is suitable. It gives a good balance between realism and simplicity, especially because yield stress effects are minor. This is due to the relatively high shear rates and larger diameters in such vessels, where blood behaves more like a Newtonian fluid.
Modeling the Stenotic Region as a Porous Medium
Our pulmonary artery model is not based on patient data but was created manually (as we did not have access to CT scans or other medical imaging). However, the simulation process is essentially the same: If CT data were available, it could be processed in specialized software and exported as an STL surface mesh, which can then be imported into the COMSOL Multiphysics® software for 3D simulation.
After importing the surface mesh into the software as a mesh part, we can create the porous domain — the stenosis — by introducing a new surface inside the mesh. This allows us to control the size and location of the stenosis, and once defined, we can generate the simulation domain, apply a tetrahedral mesh, and add boundary layers along the artery walls to ensure the mesh is suitable for blood flow simulations.
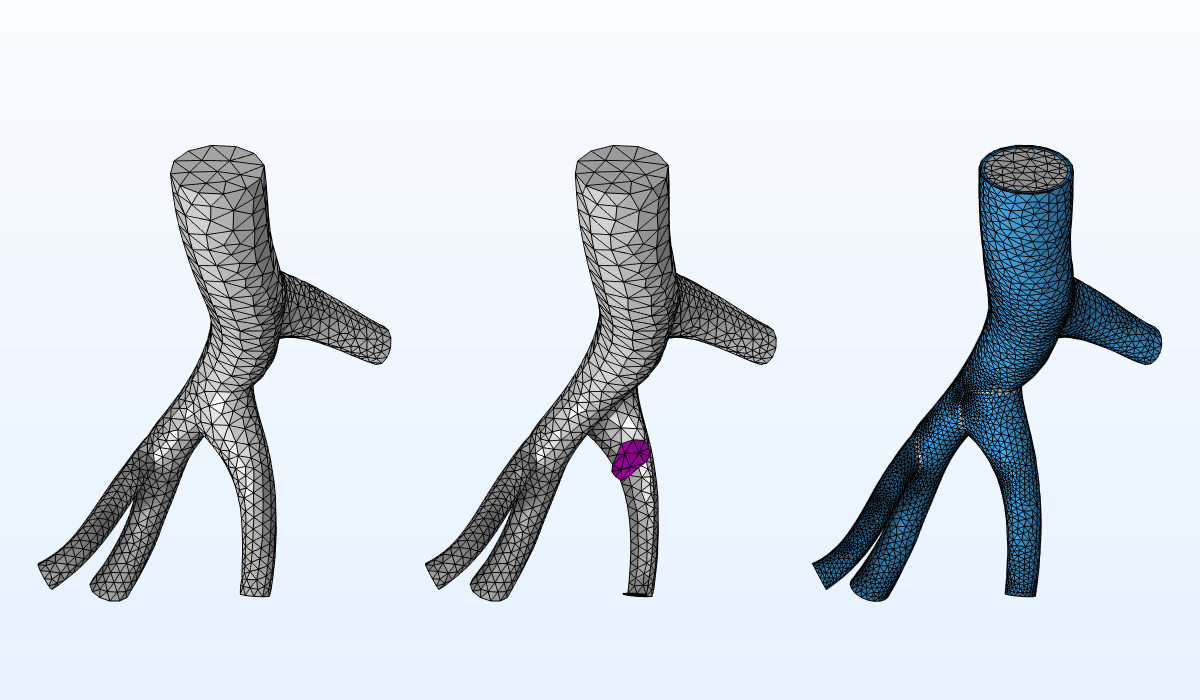 Imported surface mesh (left), introduced surface (middle), and mesh ready for CFD analysis (right).
To describe the stenosis as a porous medium, porosity and permeability are the key parameters. Porosity represents the fraction of void space in the stenosed region, and permeability quantifies the ability of blood to flow through the narrowed area. Lower porosity and permeability indicate more severe stenosis, which leads to higher pressure drops and increased flow resistance. In the previous blog post, we explored how non-Newtonian flow in porous media is modeled at the pore scale to derive an apparent shear rate method. We now build on that idea and apply the apparent shear rate method to model the stenotic region. This allows us to avoid resolving the exact geometry of the narrowing while still capturing its effect on blood flow. This makes it easier to vary the size, severity, and location of the stenosed region within the geometric model.
Modeling Blood as a Carreau Fluid
We use the Carreau model to describe the apparent viscosity of blood, accounting for its shear-thinning behavior under varying flow conditions:
This model defines the viscosity at both zero \mu_0 and infinite \mu_\textrm{inf} shear rates, along with the relaxation time \lambda and power index n. In the free-flow region, the shear rate is \dot\gamma, while in the stenotic region, it is replaced by the apparent shear rate \dot\gamma_\textrm{app}, which accounts for the effects of the porous structure on blood viscosity. The exact form of \dot\gamma_\textrm{app} depends on the porous medium and must be determined from measurements or pore-scale simulations using, for example, mathematical models like in the first section and following the procedure as discussed in the previous blog post. However, in this model, we approximate \dot\gamma_\textrm{app} using the capillary bundle approach, assuming that the stenosis shape resembles a capillary, which is reasonable:
The apparent shear rate depends on porosity, permeability, and the velocity magnitude |\mathbf{u}|. The constant C accounts for tortuosity effects, and n is the power index from the Carreau model. Although this is a simplified approximation, it allows us to analyze the hemodynamic effects of stenosis and provides valuable insights for medical diagnosis.
Model Setup
The model was inspired by the work in Ref. 1. To simulate blood flow, we apply a similar time-dependent velocity at the inlet (v_in(t)). The shape of the pulse is defined using an interpolation function, which in turn is used in an analytic function to make it periodic. At the outlets, we set a constant pressure condition.
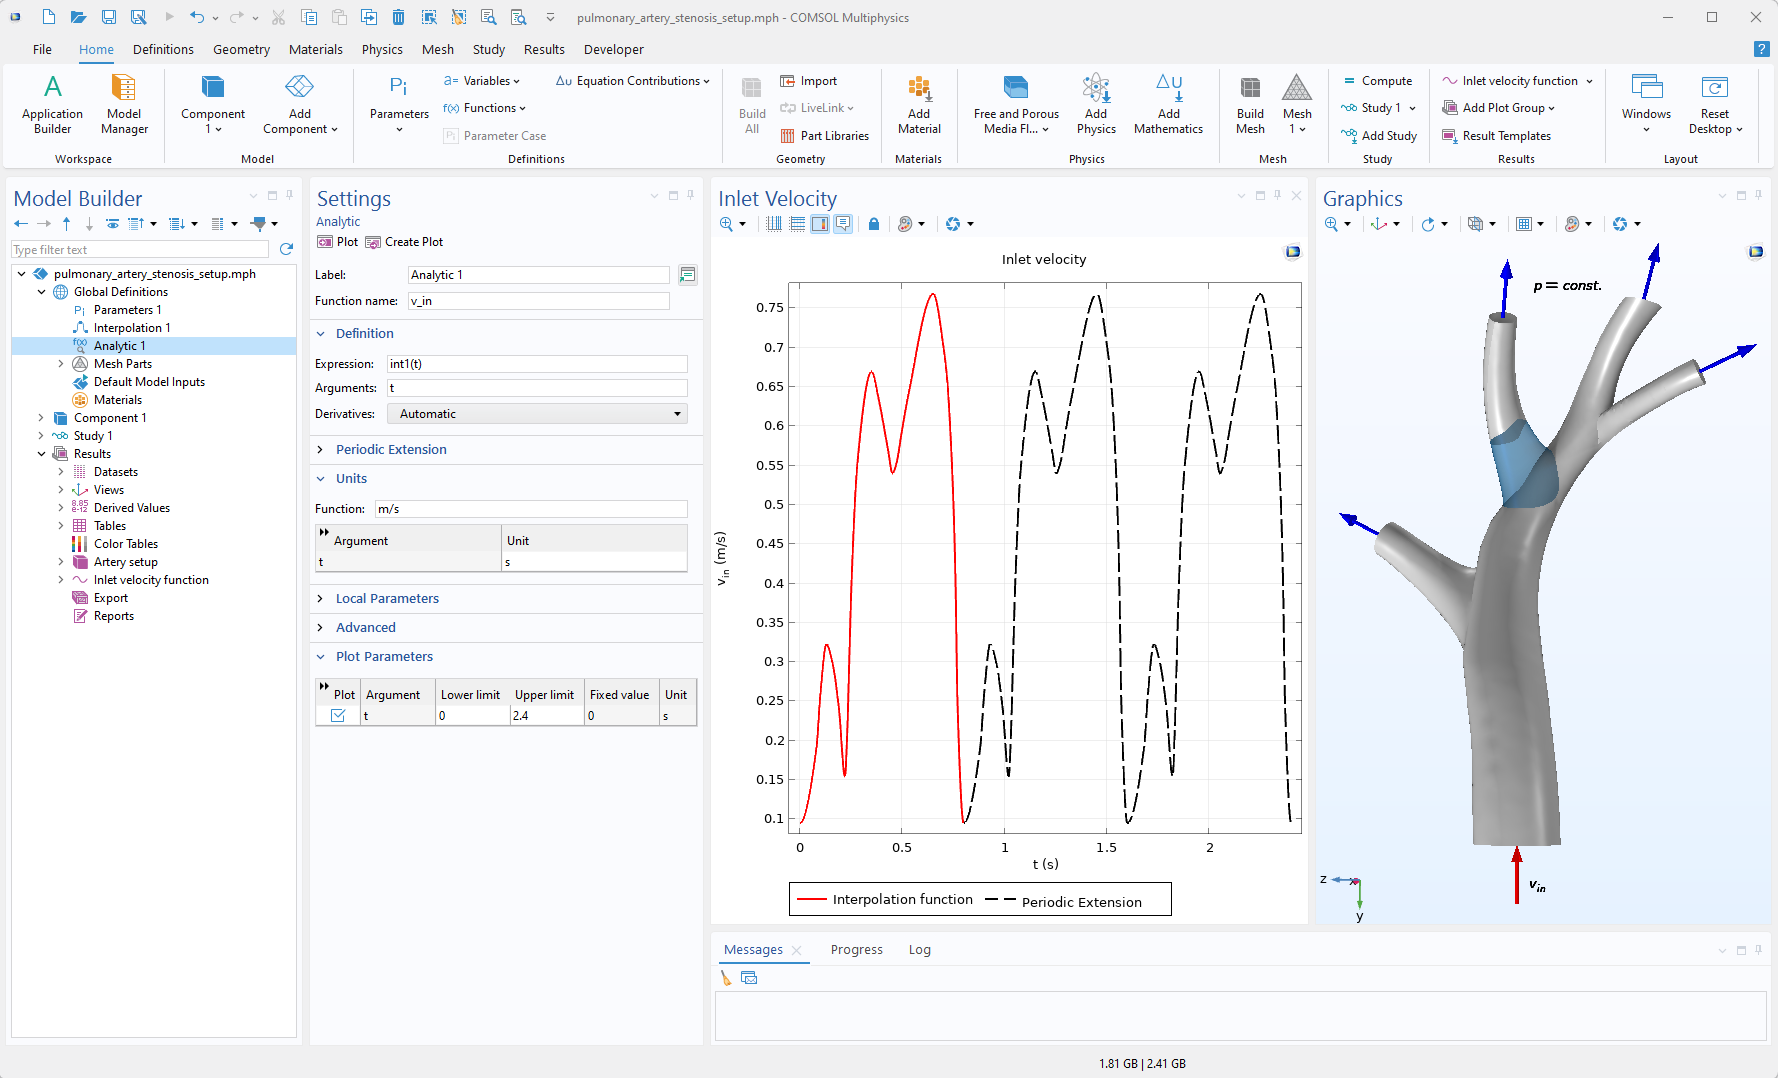 Setup of the inlet velocity function. The Graphics window shows the geometry and applied settings. The blue domain is the stenosed region.
From our earlier model, we obtain approximate values for porosity \epsilon_p=0.5 and permeability \kappa=10^{-7} m^2. These values represent significant narrowing and also correspond to the values used in Ref. 1.
To provide a good starting point for the time-dependent study, we first perform a stationary study using the inlet velocity at time zero. This provides a realistic initial flow profile, which is then continued with the time-varying velocity shown in the figure above. For this, we use the expression v_in(try_catch(t,0)) at the inlet. The argument try_catch(t,0) ensures that the function uses the current time during the transient step and time zero during the stationary step. This approach eliminates the need for separate inlet boundary conditions — one for the stationary study (v_in(0)), where time is undefined and another for the transient simulation (v_in(t)).
Results
A comparison of the blood flow simulations with and without stenosis reveals a significant increase in pressure at the proximal end of the stenosis, as expected. This elevated pressure can lead to increased stress on the arterial walls, potentially contributing to vascular damage. Additionally, the presence of a stenosis induces more turbulence downstream, which can increase the risk of blood clot formation.
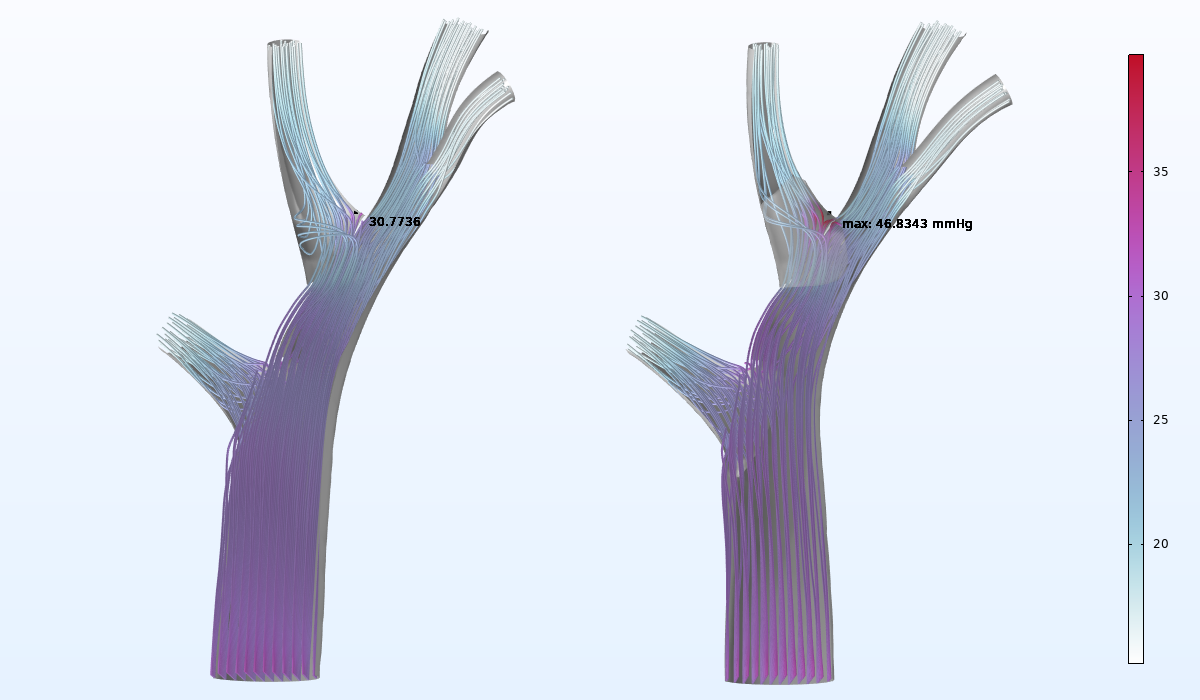 Flow field in the healthy (left) and stenosed artery (right), with color indicating the pressure and the location of the maximum pressure.
A useful measure for quantifying stenosis severity is the quantitative pulmonary pressure ratio (QPPR), defined as the ratio of maximum pressure at the distal to the proximal end. A lower QPPR indicates a greater pressure drop and thus a more severe stenosis. This ratio helps assess how significantly the narrowing affects blood flow. In this model, QPPR is approximately 0.8.
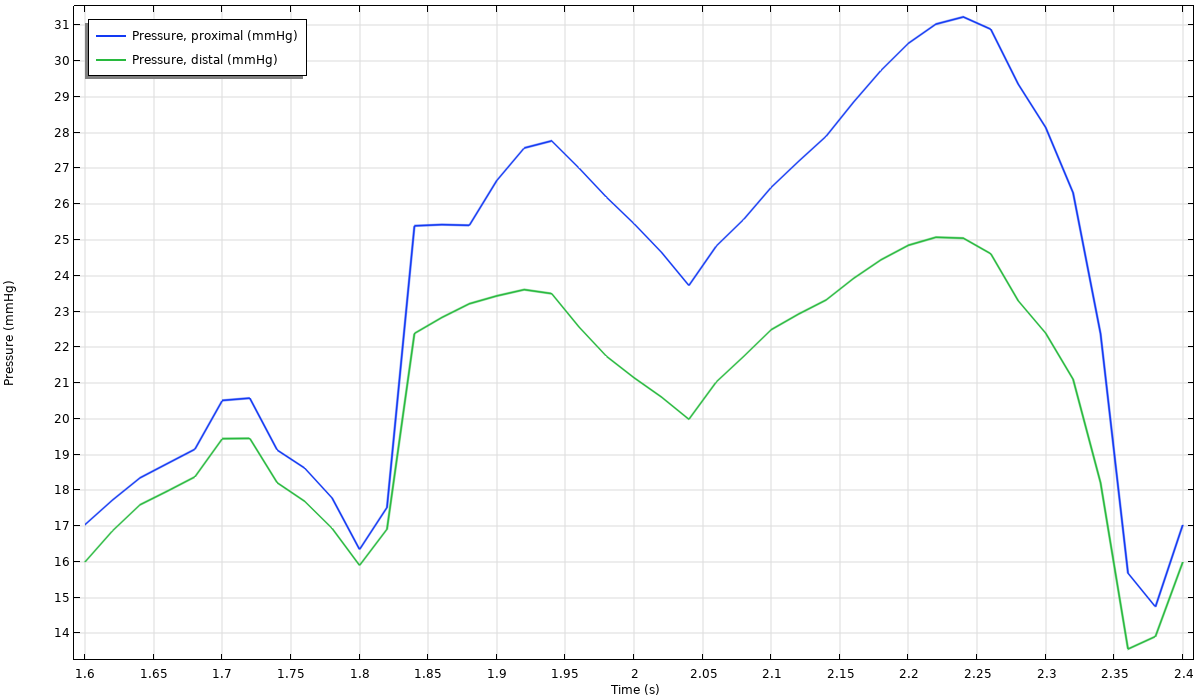 Maximum pressure at the proximal and distal ends of the stenosis over one heartbeat cycle.
Next Steps
This blog post demonstrated how blood flow in a stenosed pulmonary artery can be efficiently modeled by treating the narrowing as a porous region. Combined with the Carreau model and the apparent shear rate method, this approach captures key effects such as pressure increase and flow disturbances. The results highlight how stenosis significantly affects hemodynamics. You can download the model and step-by-step instructions here:
Reference
- He, Fan, Wang, Xinyu, Hua, Lu, Guo, Tingting, Non-Newtonian Effects of Blood Flow on Hemodynamics in Pulmonary Stenosis: Numerical Simulation, Applied Bionics and Biomechanics, 2023, 1434832, 7 pages, 2023. https://doi.org/10.1155/2023/1434832


Comments (0)