

In a previous blog post, we introduced the Cividis color table and discussed the limitations of traditional rainbow color maps for users with color vision deficiencies. Since then, the COMSOL Multiphysics® software has expanded to include even more accessible and perceptually uniform color tables. In this blog post, we’ll look at the other accessible color tables available in the software, discuss when they can be useful, and show how to create your own custom color tables.
Read the previous blog post here.
Why Accessibility Matters
Color vision deficiency (CVD) can make it difficult to distinguish between certain colors. The most common form is red–green color blindness, which affects the ability to differentiate between shades of red and green. People with CVD may find it difficult to analyze or may misinterpret results presented in a standard rainbow color table or grayscale. Because simulation results are often shared with a wide audience, choosing an accessible color table can help make the results easier for more people to interpret as intended.
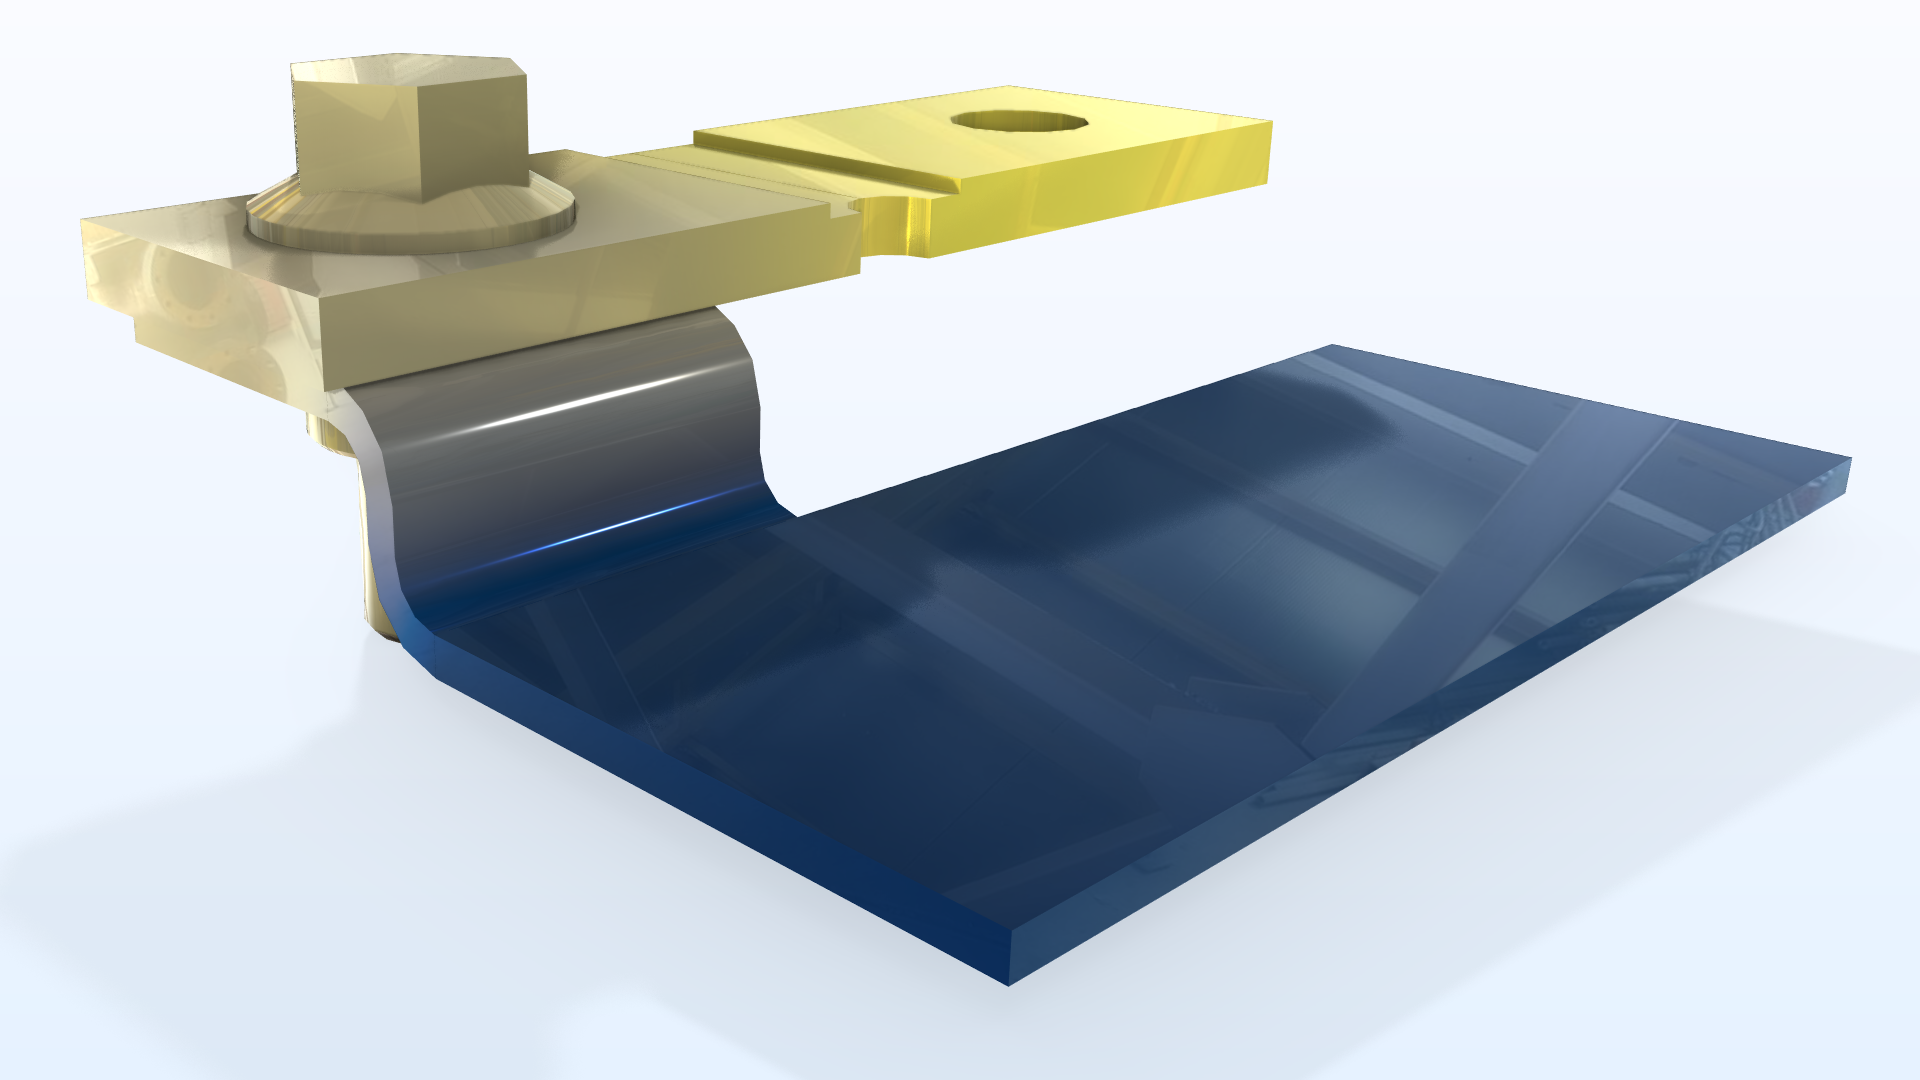 The electric potential of an atmospheric busbar shown using the Cividis color table option available in COMSOL Multiphysics®.
Built-In Accessible Color Tables
COMSOL Multiphysics® includes several built-in color tables that are both perceptually uniform and well suited for accessible scientific visualization including Cividis, Viridis, Inferno, Magma, and Plasma.
The tables being “perceptually uniform” means equal changes in your data appear as equal changes in the colors. Accessible color tables provide smooth, consistent changes in both color and brightness, making it easier to identify gradients. These color tables provide a range of options for presenting simulation results clearly while remaining accessible to a broad audience. Whether you’re visualizing temperature distributions, stress concentrations, fluid flow, or electric fields, your choice of color table plays an important role in communicating the model’s underlying physics.
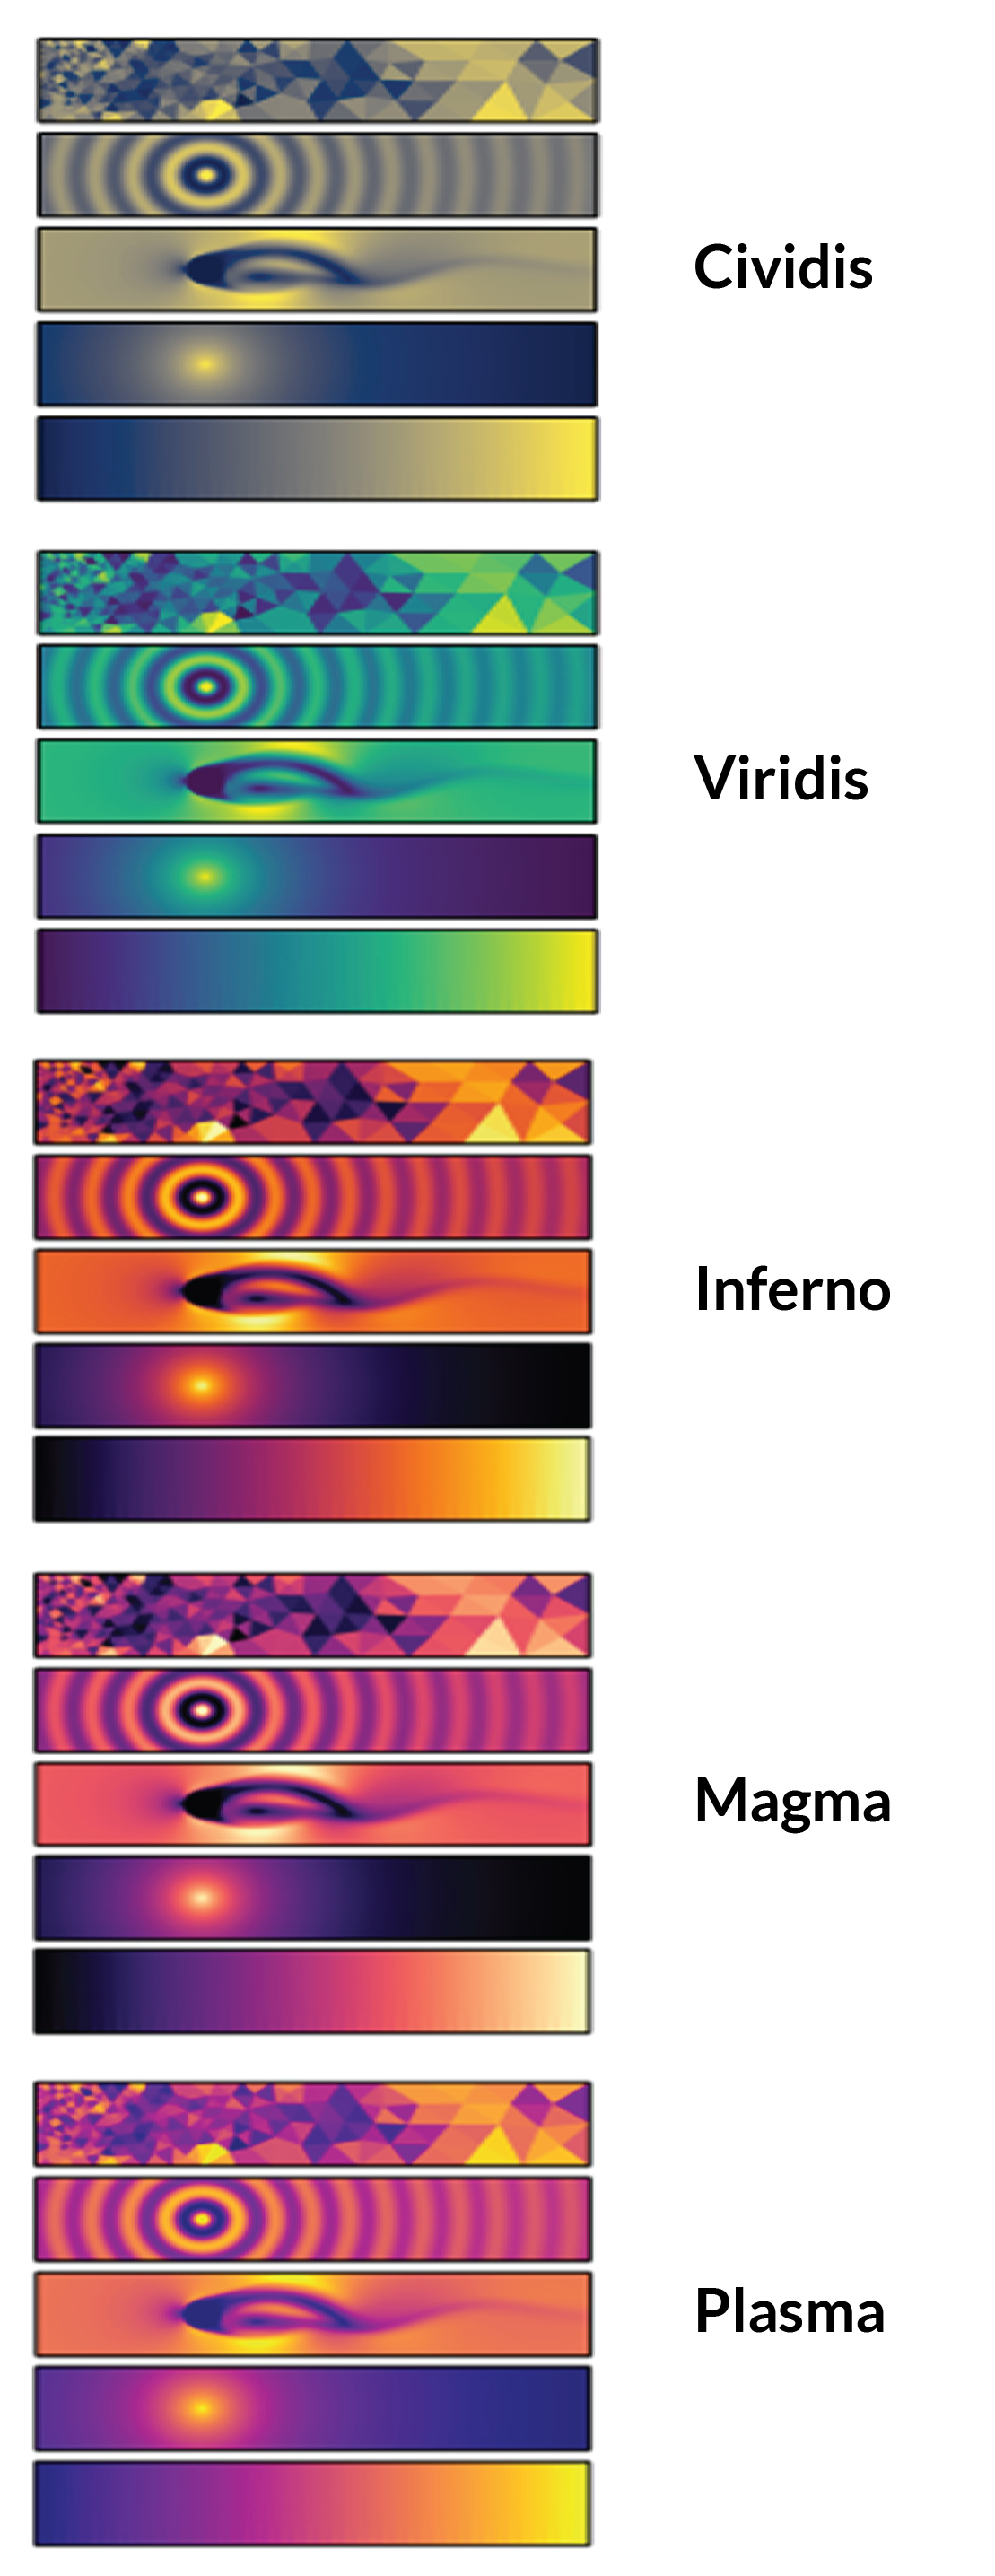
Example mesh plots, propagating waves, wake regions, singularities, and smooth gradients for each color table.
While all five color tables can be used across a wide range of applications, some may be better suited for different types of simulation results. Viridis and Cividis are good choices for stress, strain, pressure, velocity, and concentration, where smooth gradients help reveal variations. Inferno and Magma can help emphasize temperature distributions and thermal gradients, providing strong contrast. Plasma can be useful for quantities such as electric and magnetic field magnitude and current density, where its distinctive color progress can help highlight variations in the field.
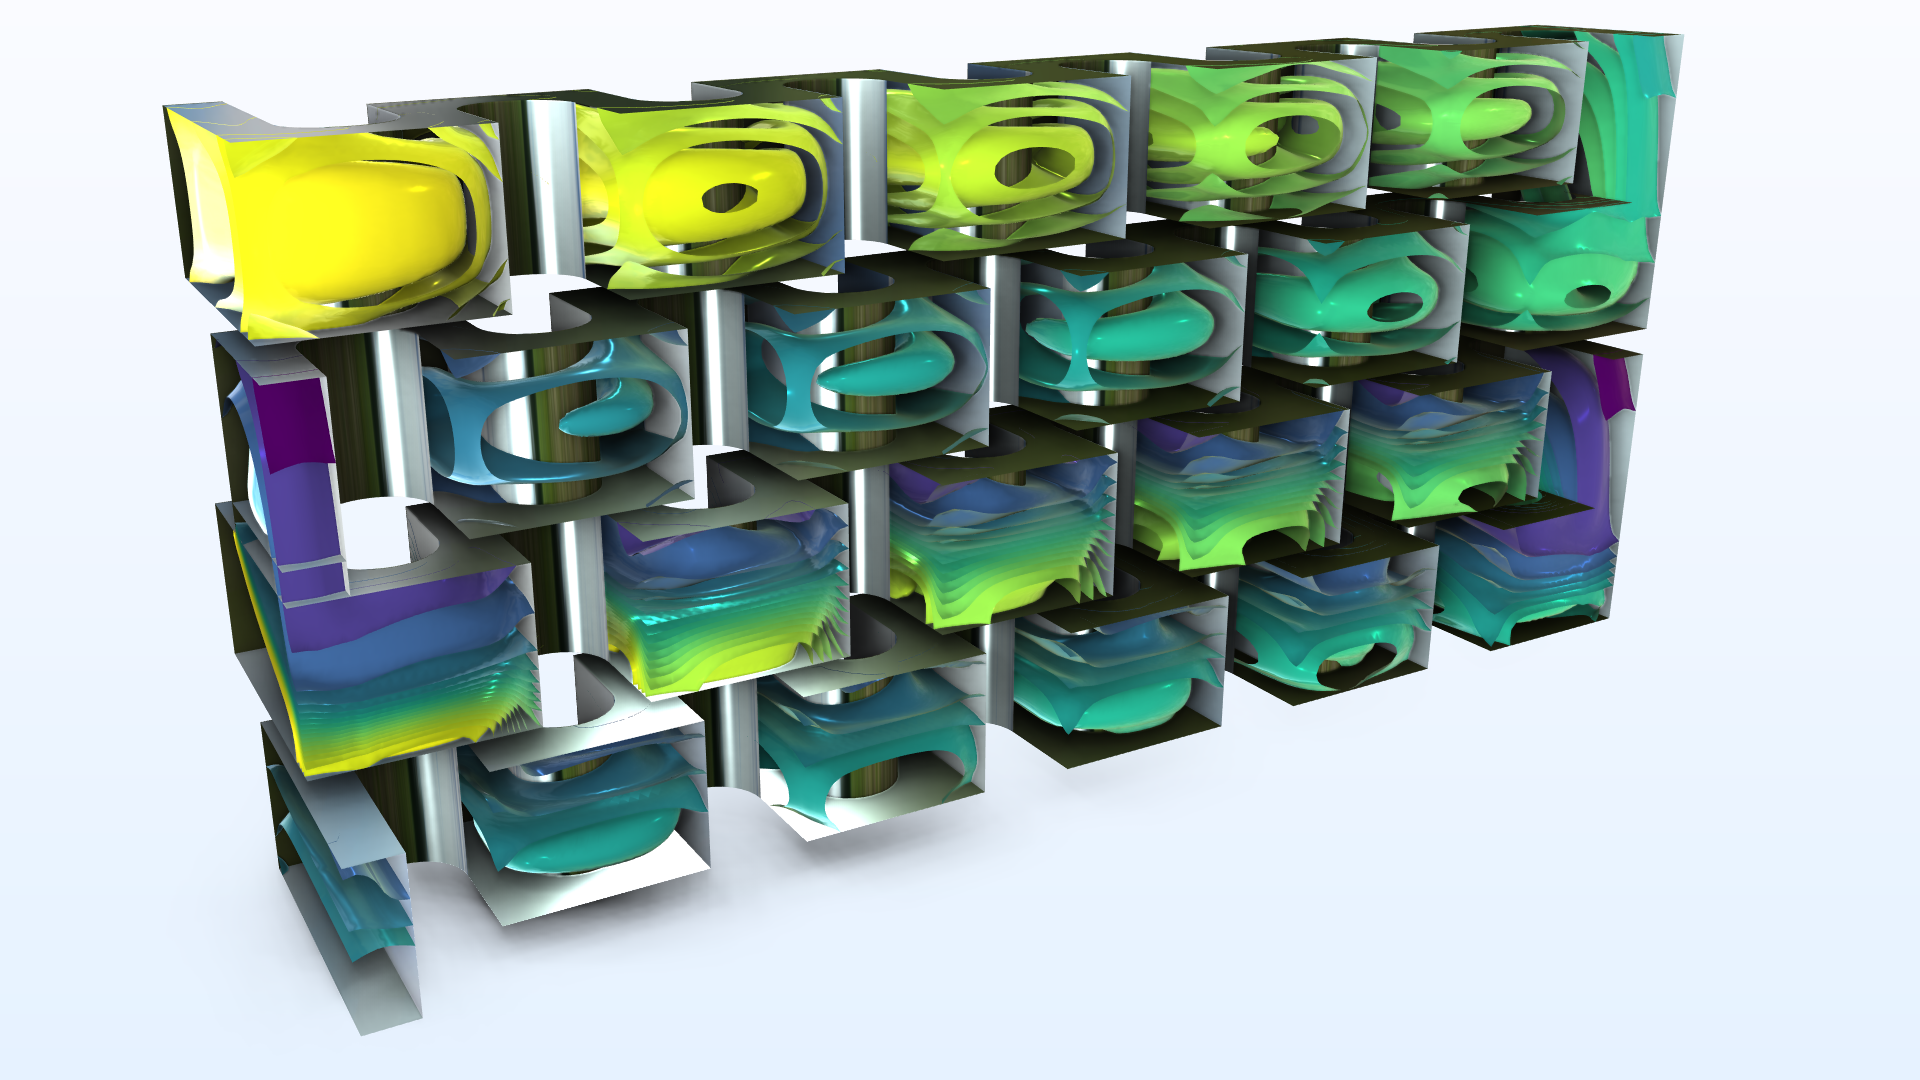 Results from a plate reactor model visualized using the Viridis color table.
 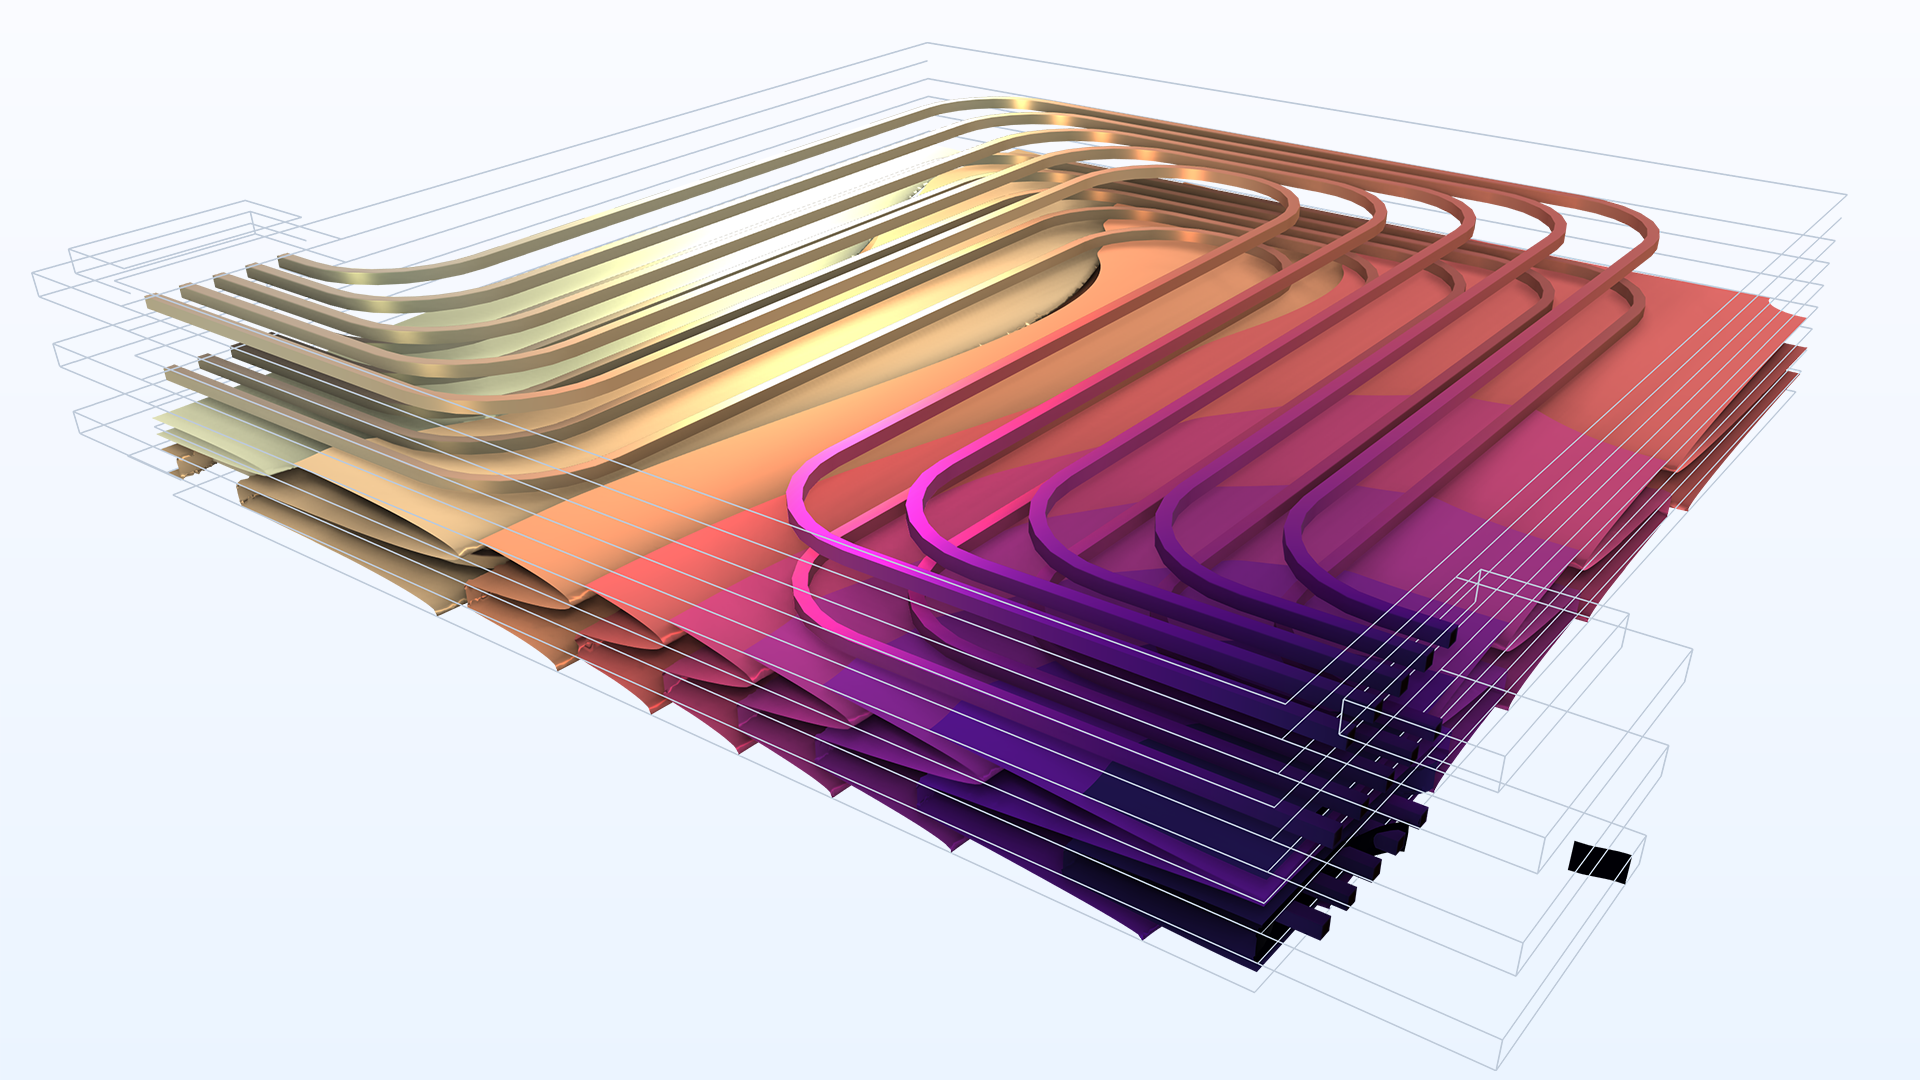 Results from a liquid-cooled battery pack model visualized using the Magma color table.
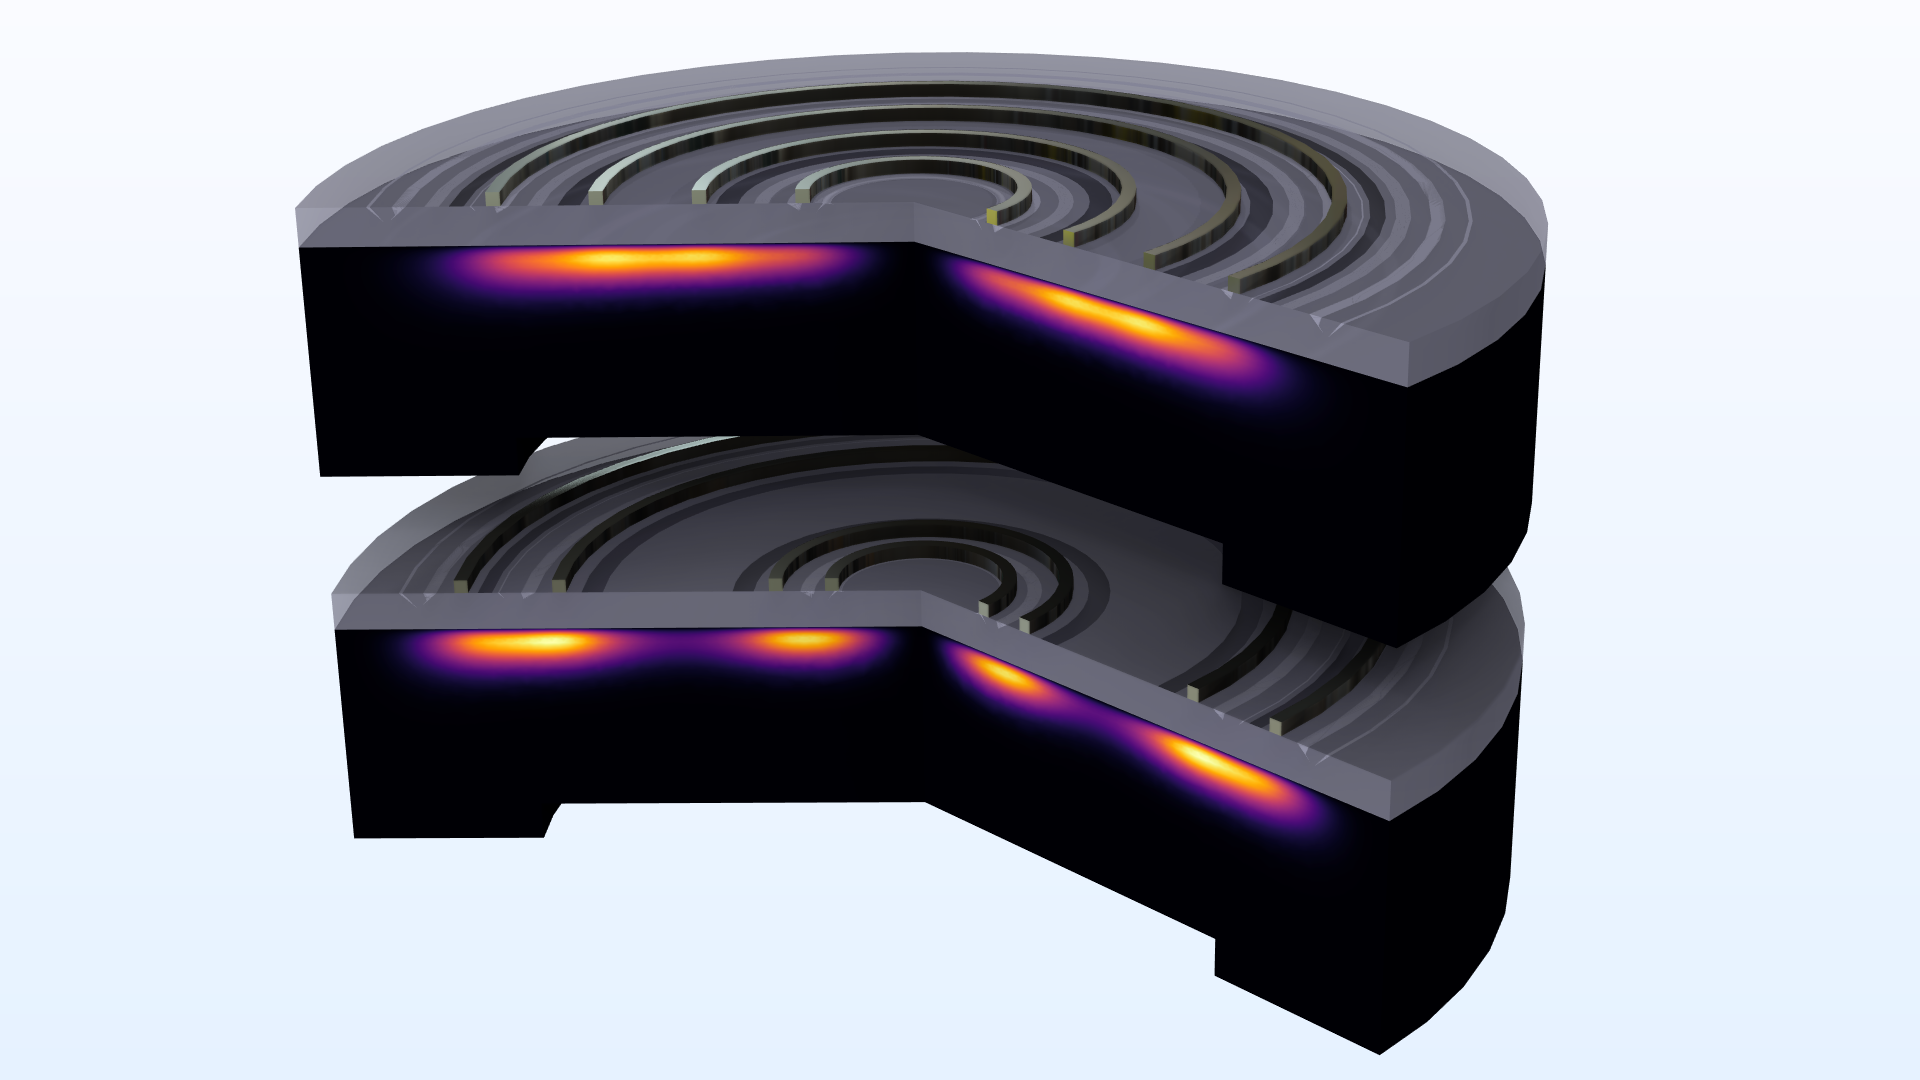 Results from an inductively coupled plasma reactor model visualized using the Inferno color table.
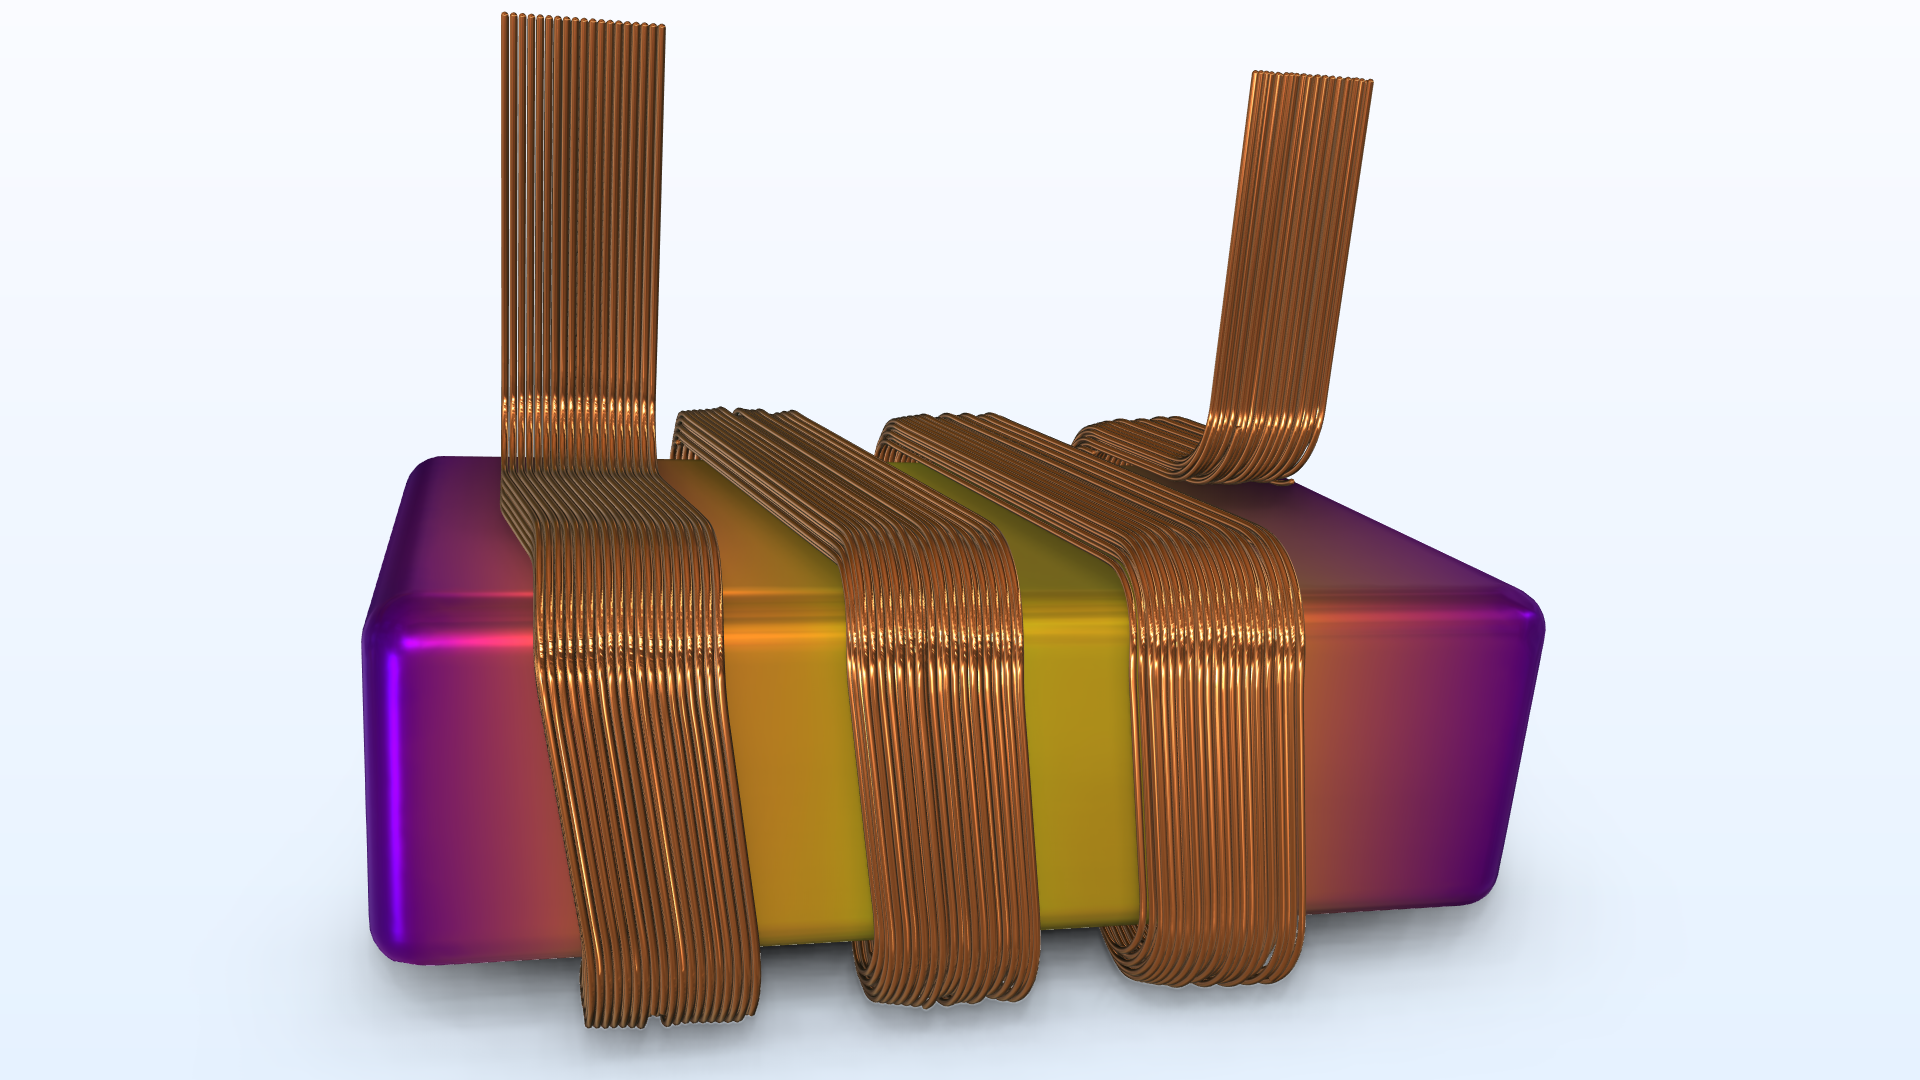 Results from an inductor model visualized using the Plasma color table.
In addition to these perceptually uniform color tables, COMSOL Multiphysics® includes the GrayScale linear color table. This option can be particularly useful when hue should not influence the interpretation of a result, or when you want to emphasize the intensity of a quantity without introducing additional color information. However, note that humans can only distinguish between about 30 different shades of gray, so it may be more challenging to notice small changes in a grayscale format.
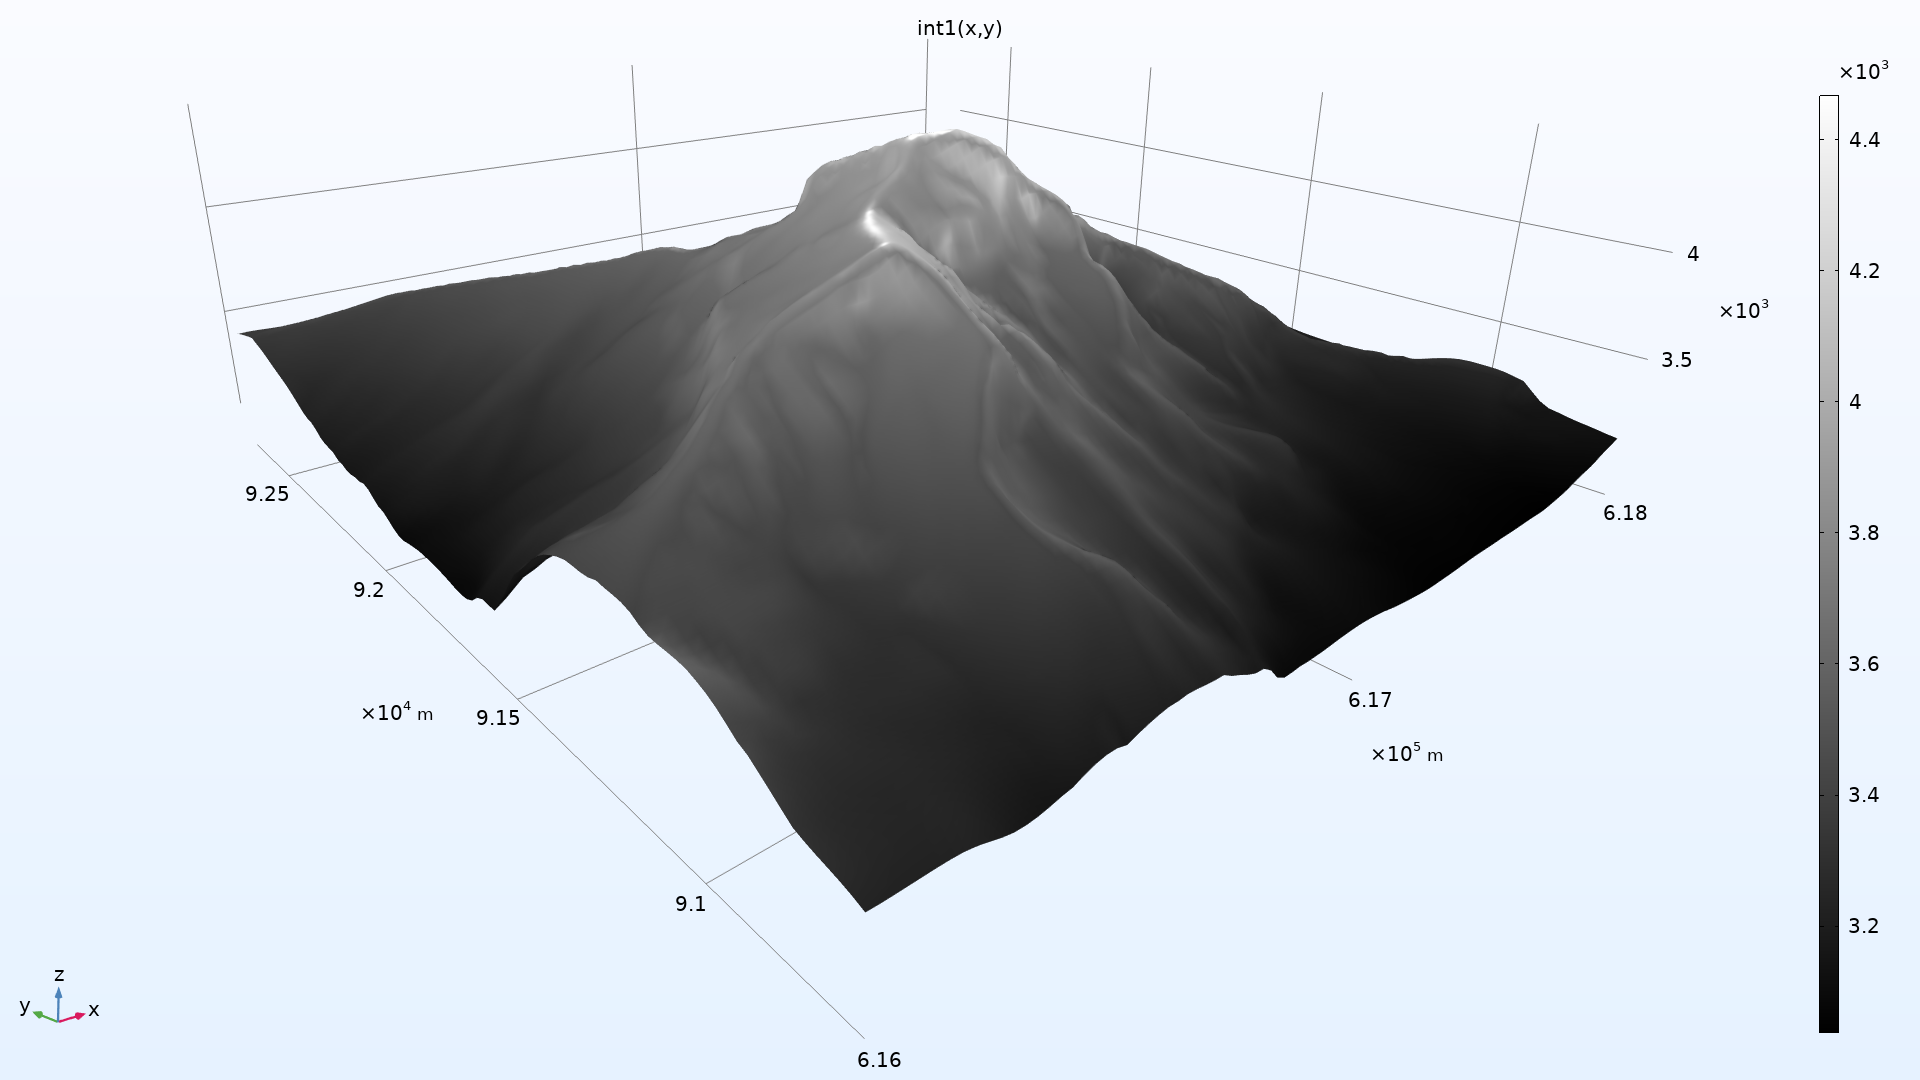
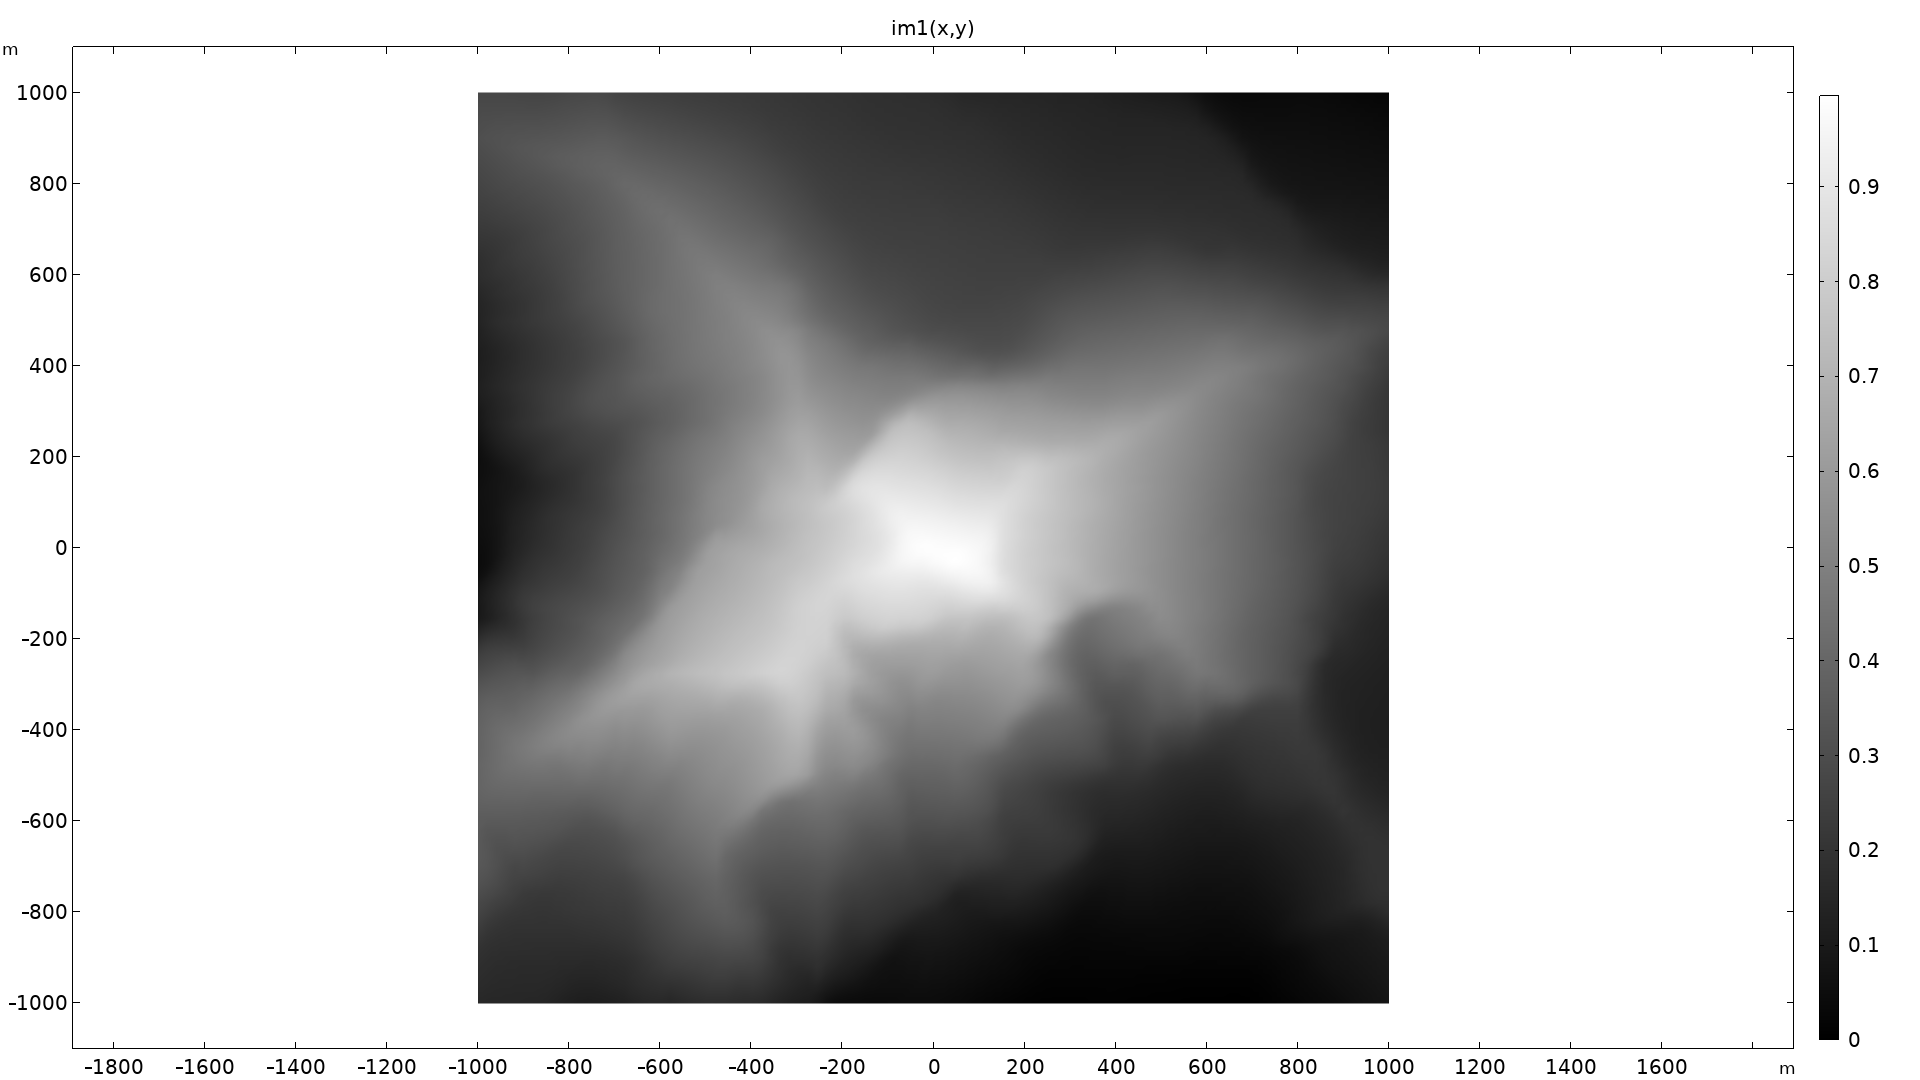
A plot showing the interpolation function (left) of a model resembling the Alpine mountain the Matterhorn. The grayscale image (right) shows the height of the mountain. Note that the color bar is normalized to go from 0 to 1.
Transforming Color Tables
Color table transformations available in the settings of results plots, including Reverse, Nonlinear, and Nonlinear symmetric options, provide additional flexibility in how colors can be used to represent simulation results. They can be used to adjust the appearance of a color table and change how variations in the data are displayed. A transformation can be used to adjust the appearance of a color table and change how variations in the data are displayed. It can be used to emphasize or de-emphasize different parts of a result and provides another way to tailor a color table to a particular application or type of data.
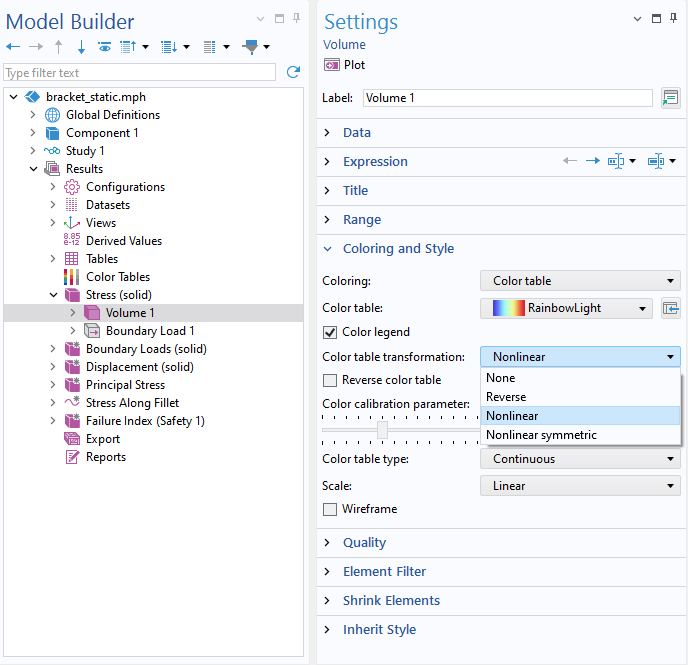 The available color table transformations.
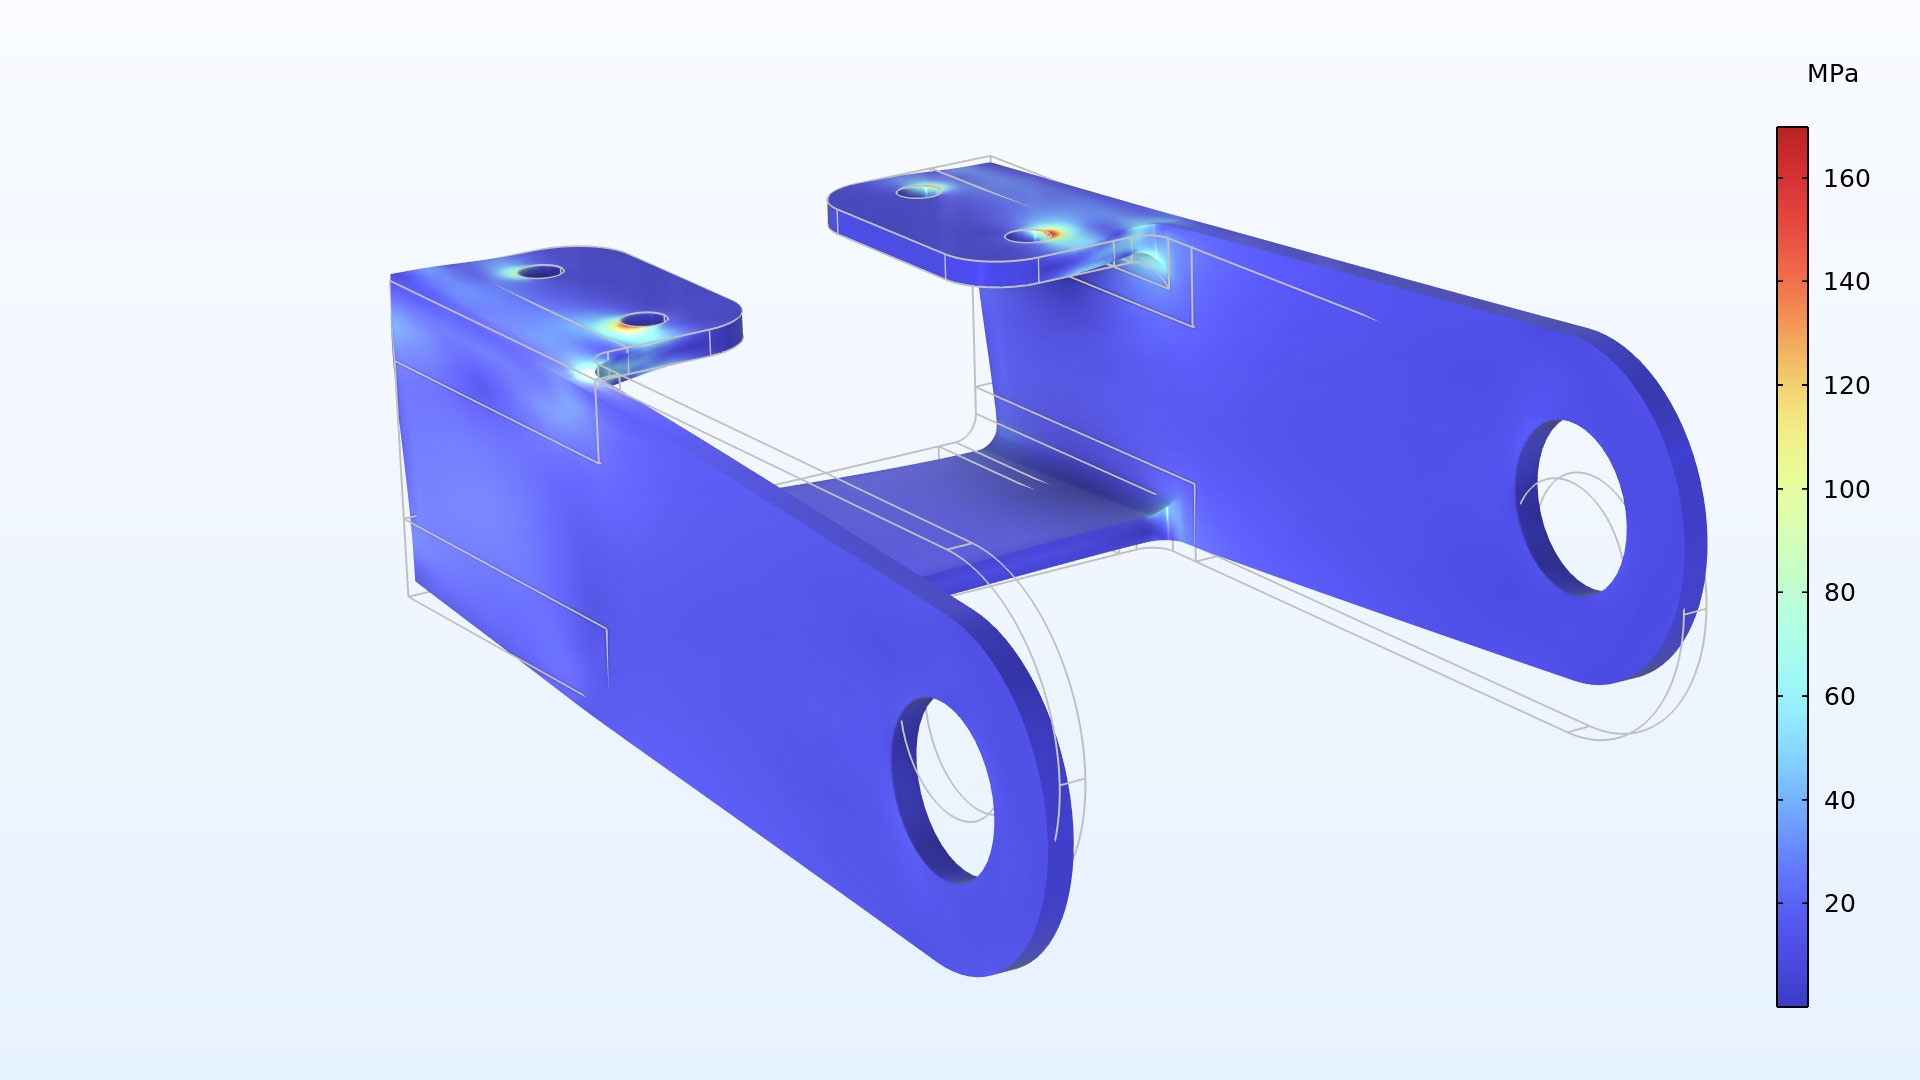
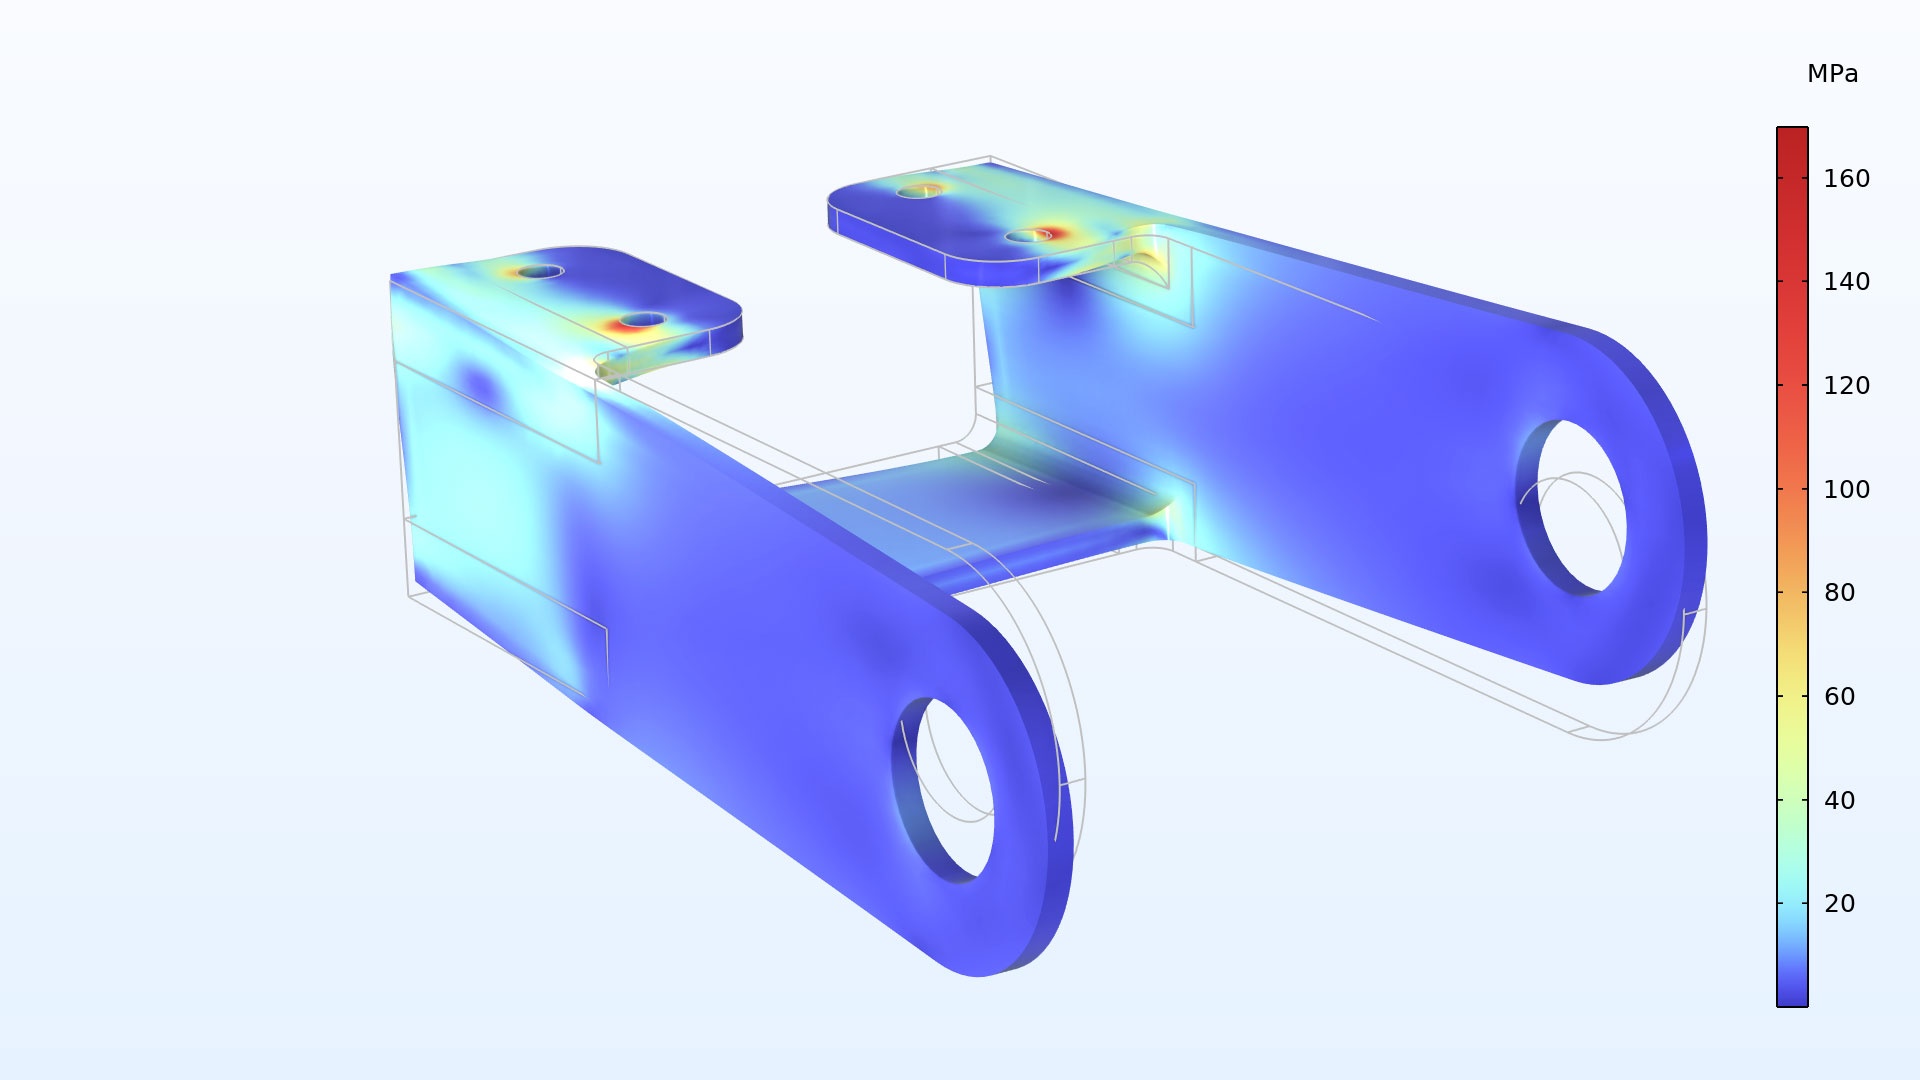
The von Mises stress in a bracket without a color table transformation applied (left). The von Mises stress in a bracket with the Nonlinear color table transformation applied. (right)
Custom Color Tables
In addition to the built-in color tables, version 6.1 of COMSOL Multiphysics® introduced support for custom color tables. You can import color table files, edit the RGB components of a color table directly, and refer to color tables stored on disk or in a database.
This flexibility makes it possible to develop custom visualization styles for specific applications while maintaining control over how simulation results are represented.
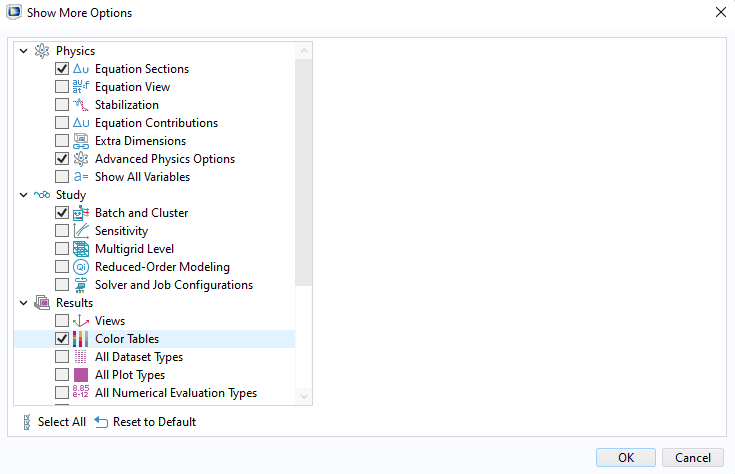 To add a Color Tables node to the model tree, open the Show More Options dialog and select the Color Tables checkbox.
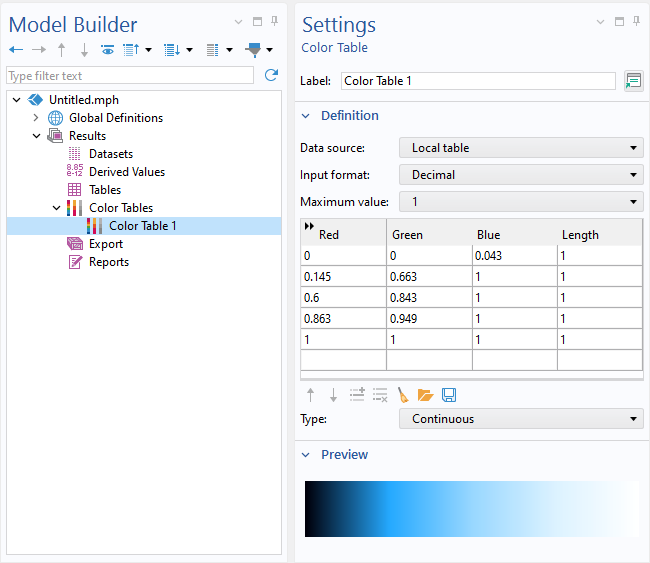 The Color Tables node used to define a custom table. When values are defined for a custom color table, a preview will appear in the Settings window.
Accessible Visualizations
Choosing an appropriate color table is an important part of communicating simulation results. By using perceptually uniform and accessible color tables, you can create visualizations that accurately represent your data while making your results easier for a wider audience to interpret. With the built-in Cividis, Viridis, Inferno, Magma, and Plasma color tables, as well as GrayScale and support for custom color tables, COMSOL Multiphysics® provides a range of options for creating clear and accessible simulation visualizations.





Comments (0)