

Simulation is used in almost every engineering field to predict the performance of a component in a virtual environment. However, that is not the only advantage of the technique. Understanding the main parameters affecting performance adds value to the design process. One way to understand this relationship is by performing a sensitivity analysis in the COMSOL Multiphysics® software. Here, we show how to use the Sensitivity study step using a truss tower subject to bending and torsion loads.
What Is Sensitivity Analysis?
If you have ever investigated the effect of changing a parameter in your model, you have essentially already performed a sensitivity analysis with respect to that parameter. Such a parameter can be, for example, a material property, a load, or a geometrical distance. There are two main situations when it is important to study sensitivities:
- You need to characterize how sensitive the response is with respect to uncertainties in the input data; for example, manufacturing tolerances or material properties
- You need to make changes to improve the performance of a design and want to find out which changes that are most efficient for attaining your goals
Obviously, the response will change more if the parameter perturbation is large, so it makes sense to divide the change in whatever you are measuring by the size of the parameter perturbation in order to get a normalized measure of the sensitivity. You can then compare this normalized number to similar numbers computed in the same way for other parameters, assuming that the parameters are somewhat equivalent and have the same unit.
This type of (more or less manual) analysis of the sensitivity is called a forward difference analysis and its cost scales with the number of parameters. It works best for cases where the number of parameters is small. It can, however, be a bit tricky to choose the size of the parameter perturbation, because it has to be large enough to avoid numerical noise and small enough to avoid nonlinear effects.
You could improve the accuracy by both increasing and decreasing the parameters to get what is called central difference, as illustrated below. This is twice as expensive from a computational point of view, because you have to evaluate the model for two new values of the parameter instead of just one.
Mathematically, the sensitivity can be seen as the derivative of some result with respect to one or more input parameters, and the two methods discussed so far are two well-known ways of approximating derivatives.
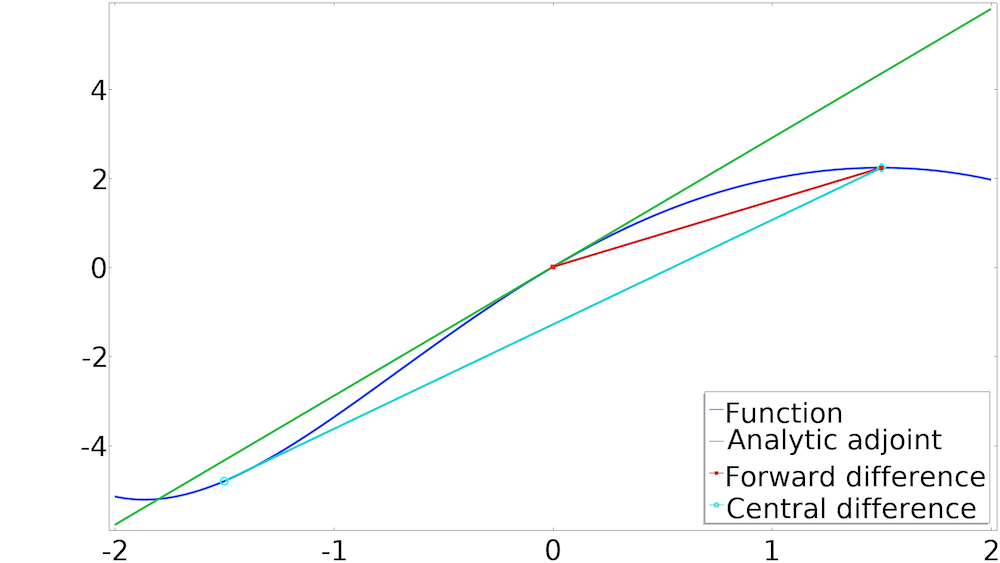
The slope of a curve can be computed using adjoint sensitivity analysis as well as a forward or central difference scheme.
Sensitivity analysis is, however, a built-in feature in COMSOL Multiphysics, so you do not need to perturb the parameters yourself. You can use the adjoint sensitivity analysis to avoid numerical parameters associated with the parameter perturbation and compute the sensitivity at the cost of a single linear solution. Conceptually, you can consider it as if you are computing a derivative using analytical methods, rather than approximating it by finite differences. This functionality is available for the stationary as well as frequency domain study types, and can be used as long as the parameters do not change the mesh.
In the example used in this blog post, we will use adjoint sensitivity analysis, because the problem considered has many parameters.
Bending and Torsion of a Truss Tower
Imagine a truss tower fixed at the bottom and subjected to a torsion and bending loads at the top, as illustrated on the left in the figure below. The model uses truss elements, which do not contain information about rotation. However, this information is required for computing the tilt and yaw.
The model uses thin beam elements (illustrated as a black cross at the top of the right-hand figure below) to measure the tilt and yaw.
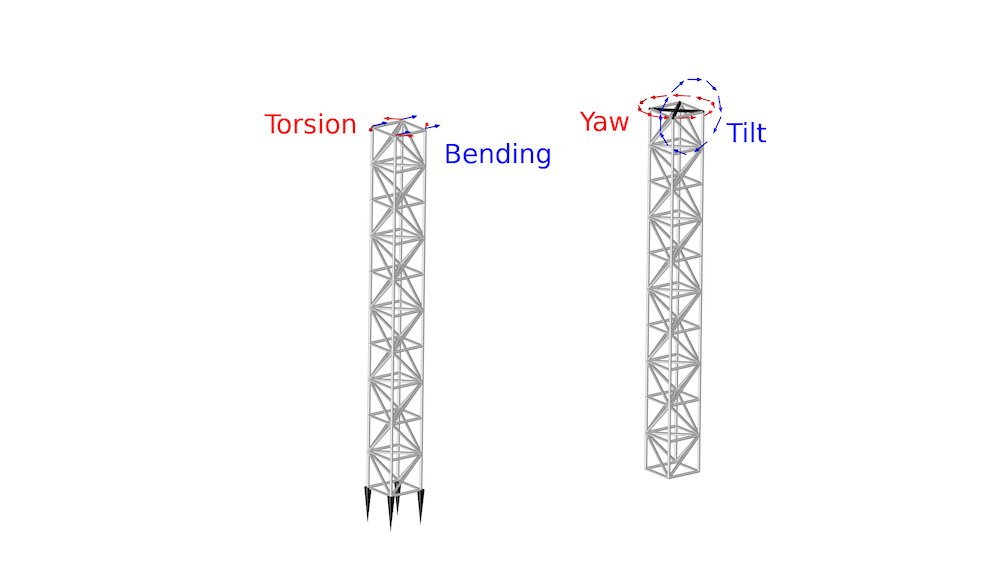
The bending and torsion load cases (left) and the definition of yaw and tilt deformation (right), which is computed using the displacements in the four top nodes.
The tilt and yaw for the torsion and bending load cases are listed in the table below:
| Load Case | Tilt Angle (deg) | Yaw Angle (deg) |
|---|---|---|
| Bending | 0.72 | 0 |
| Torsion | 0 | 1.2 |
Performing a Sensitivity Analysis in COMSOL Multiphysics®
We will investigate how sensitive the tower is to changes in the cross-sectional area of the individual bars. We do this by creating a control variable for every bar, which can be used to scale the cross-sectional areas of the bars. This can be achieved using an edge control variable field, Abar. The Sensitivity study step is included in the core functionality of COMSOL Multiphysics, but in order to add it, you have to enable it in the Show More Options dialog box.
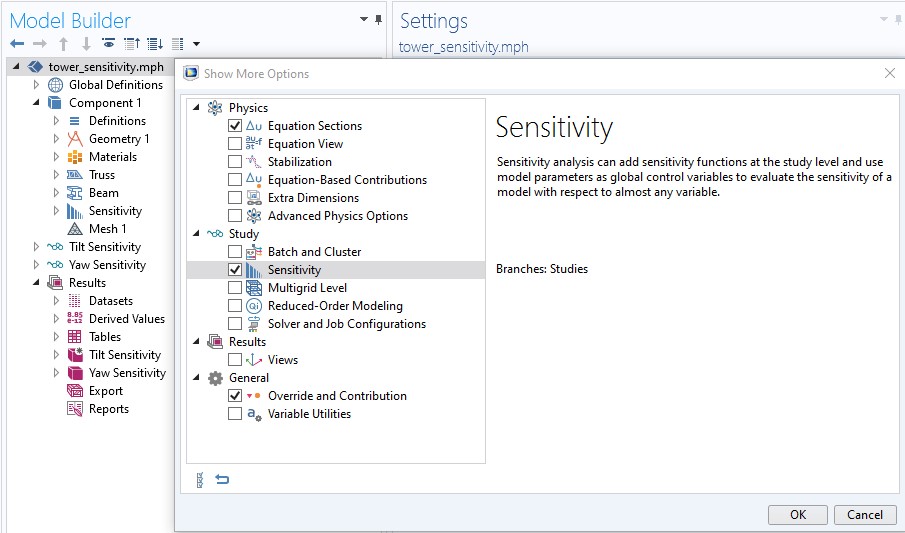
The Sensitivity study step can be enabled from Show More Options.
The control variable will show up automatically in the Sensitivity study step, but you have to define the objective function using a probe or an integration coupling operator. In either case, you type in the objective function in the Sensitivity study step, as illustrated below.

The tilt objective is defined as a variable, so it can be written directly into the Objective Function table or added using the Add Expression button.
Results of the Sensitivity Analysis
The sensitivity with respect to the control variable can be plotted using the expression fsens(abar), as shown for the tilt sensitivity below. For the bending load case, this shows that the tilt will be decreased if the vertical bars are reinforced — particularly in the lower part of the tower. The torsion load case is plotted to the right, and we can see that the tower tilt is insensitive to changes in the bar areas.
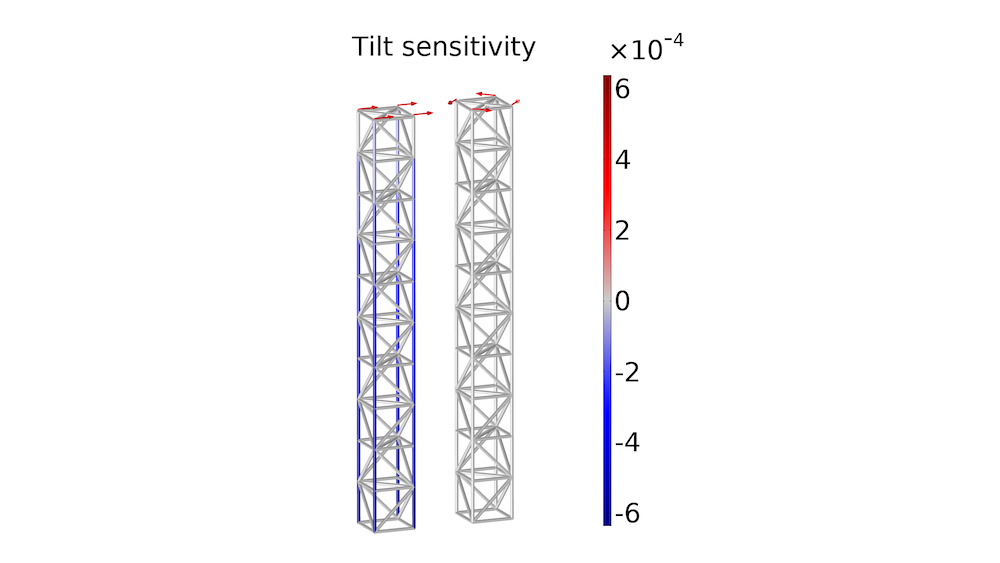
The tilt sensitivity is plotted for the bending load case (left) and the torsion load case (right).
The yaw sensitivity is plotted below. This shows that you can introduce yaw for the bending load case by reinforcing diagonal bars on one side, while weakening the diagonal bars on the opposite side. Doing this will break the symmetry such that the tower top will yaw in response to the bending load. For the torsion load case, the yaw can be decreased by reinforcing the diagonal bars.
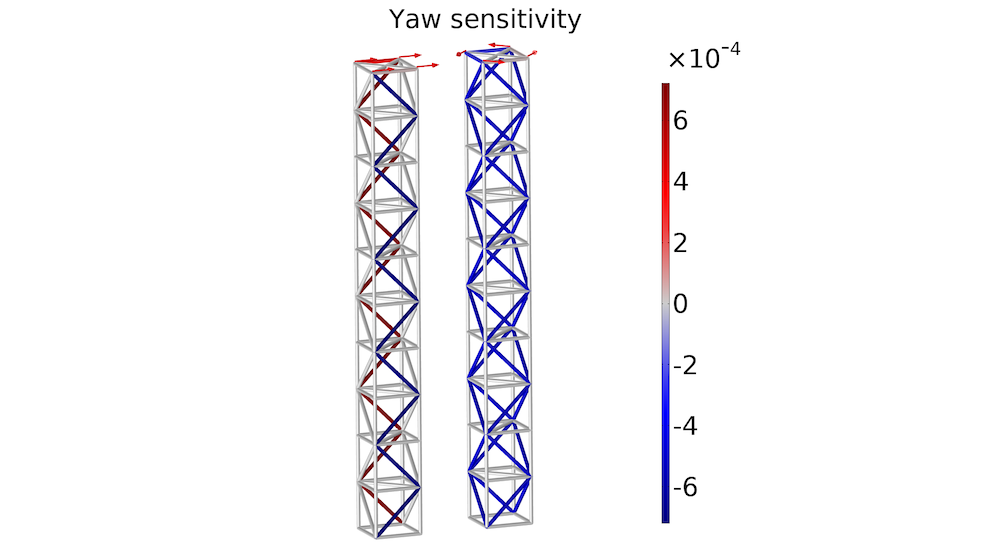
The yaw sensitivity is plotted for the bending load case (left) and the torsion load case (right).
Neither the tilt nor the yaw is sensitive to changes in the horizontal bars, which suggests that it is possible to remove them and thereby reduce the cost of the structure. This will, however, cause the length of the vertical bars to double, so the structure will become more susceptible to local buckling.
Next Step
Try performing a sensitivity analysis yourself. Click the button below to go to the Application Gallery, which includes PDF documentation and a MPH file for the Sensitivity Analysis of a Truss Tower model.


Comments (6)
Kiran Kamath
August 17, 2023Thanks for the explanation. How to perform sensitivity analysis for material properties?
Kristian Ejlebjærg Jensen
August 17, 2023 COMSOL EmployeeYou can use the same workflow, except you define the material properties using parameters that you set as controls in the Sensitivity study step. In practice, you are rarely able to choose material parameters continuously, and the unit of the sensitivity will typically differ between the material parameters, so it can be difficult to compare the sensitivities in a meaningful way.
Kiran Kamath
April 15, 2024Thanks for your answer. I am also looking at how to quantitatively interpret the results from sensitivity analysis .
For ex; how can the numbers associated in the tilt sensitivity analysis be interpreted ? The scale range from -6e-4 to 6e-4. How to interpret these numbers?
In short, when I perform the sensitivity analysis for material parameters, I only understand that whether increasing or decreasign this parameter would have a effect on the objective function. However, I am trying to make sense also of the numbers associated with it on the scale.
Your thoughts on this would be helpful.
Kristian Ejlebjærg Jensen
April 16, 2024 COMSOL EmployeeThe unit of the sensitivity is the unit of the objective function divided by the unit of the control variable field, so in this case it is just radians (because the control variable field is dimensionless). If a certain bar has a sensitivity of 5e-4, it thus means that a a relative change, dx, of the area in that bar, will cause the tilt or yaw to increase by 5e-4[rad]*dx, but this is only true, because the discretization of the control variable field is constant in each element. In general control variables associated with bigger elements tend to have a larger effect, so it can make sense to divide the sensitivity by the dvol variable to take this into account as also described in
https://doc.comsol.com/6.2/docserver/#!/com.comsol.help.comsol/comsol_ref_sensitivity.31.09.html
Kiran Kamath
April 16, 2024Thank you Kristian for your insights on this.
Sourabh Alagundagi
May 17, 2024Hello,
I am simulating a capacitive pressure sensor and am stuck with Sensitivity Analysis.
I have used Sensitivity analysis under Study 1 and have added Maxwell Capacitance expression comp1.es.C11 as the Objective Function and selected Pressure as my Control Variable.
I am unable to understand the process involved in Sensitivity analysis as to whether Change in Capacitance divided by Change in Pressure is being computed or not which is the formula to calculate the Sensitivity.
When I check for the sensitivity vs. pressure graph in Results section, I am getting a wrong curve.
Kindly clear my doubt over what is happening behind the COMSOL Sensitivity Analysis process.
Regards,
Sourabh