
Noncommunicable diseases place a socioeconomic strain on low- to middle-income countries. The advent of noninvasive technology offers a solution, effectively diagnosing, preventing, and treating these diseases at a lower cost. For chronic kidney disease, one type of noncommunicable disease, such advancements are important because current methods are expensive and prone to error. As simulation research shows, sensors based on complementary split ring resonators (CSRRs) provide an inexpensive way to accurately monitor chronic kidney disease.
Finding Cost-Effective Ways to Diagnose and Treat Noncommunicable Diseases
According to the World Health Organization (WHO), noncommunicable diseases (NCDs) cause 38 million deaths worldwide each year. Among these deaths, nearly three-fourths take place in low- to middle-income countries. Therefore, WHO has made it a point of focus to make cost-effective forms of prevention for NCDs available in these countries.
In recent years, noninvasive technology has emerged as a potential solution, delivering effective (and pain-free) healthcare at a low cost. This technology, which includes wearable sensors and other portable lightweight devices, can provide continuous monitoring of a patient’s health and thus enable doctors to better diagnose and treat such diseases. Let’s look at the role of this technology in monitoring a specific type of NCD: chronic kidney disease (CKD).
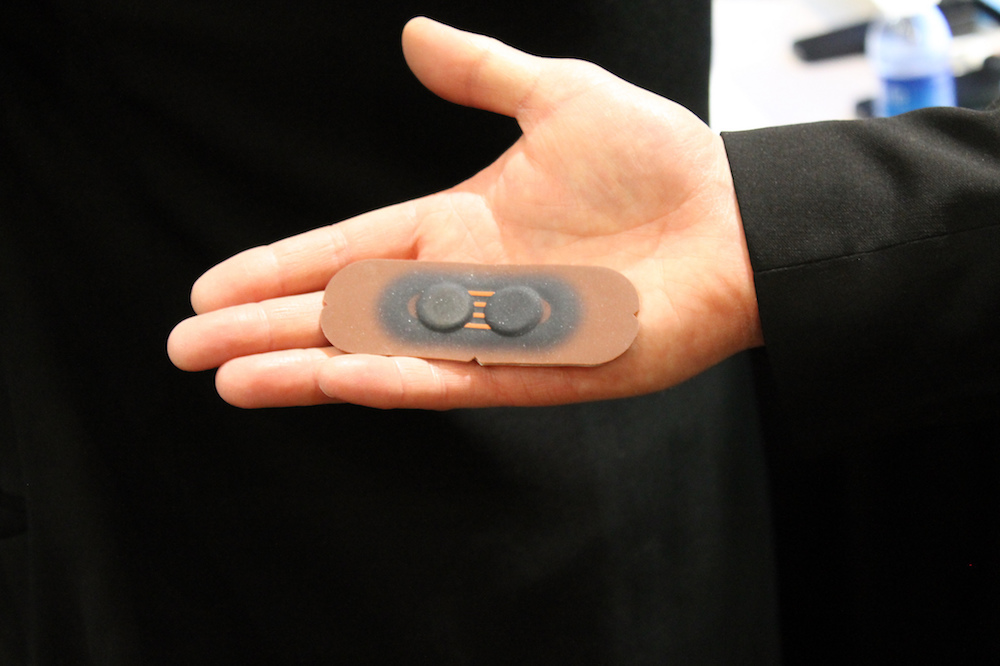
To continuously monitor a person’s heart rate, this wearable sensor simply needs to be attached to the skin with an adhesive. Image by CES Unveiled. Licensed under CC BY 2.0, via Flickr Creative Commons.
The Connection Between Creatinine Levels and Chronic Kidney Disease
Within the human body, kidneys filter out waste products from the blood. One of these waste products is creatinine, which is produced by muscle metabolism. If the kidneys are not functioning as they should, the creatinine concentration levels in a person’s blood become quite high. Thus, these levels can provide important insight into the slowdown of kidney function, a gradual process that can lead to chronic kidney disease.
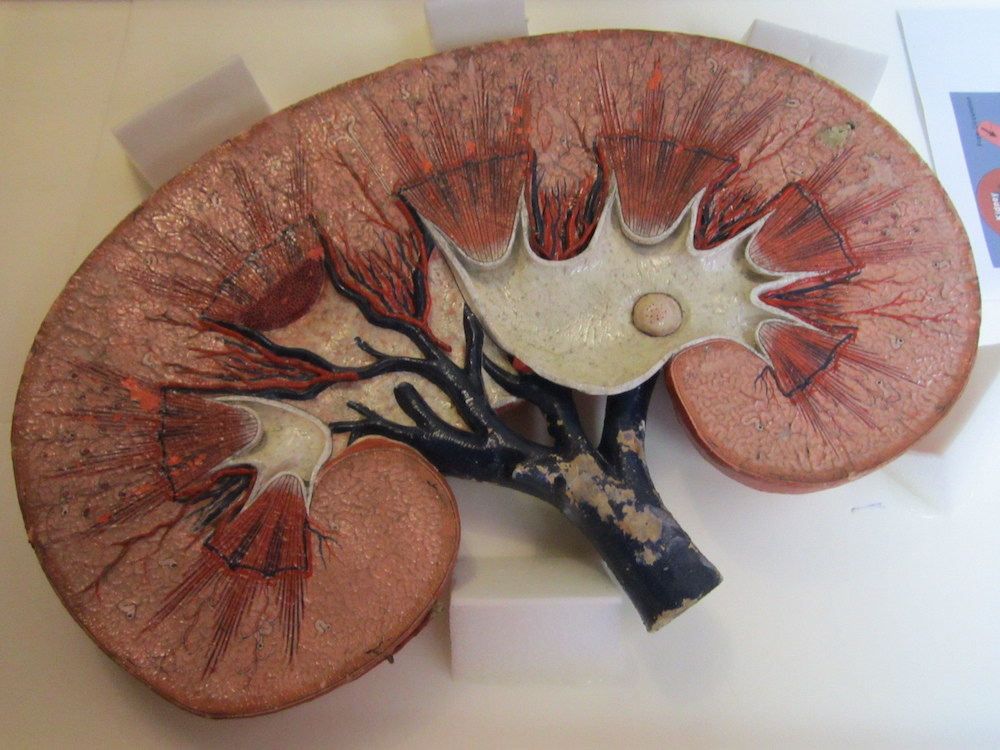
A model of a healthy kidney, which filters waste products like creatinine out of the blood. Image by the National Museum of Health and Medicine. Licensed under CC BY 2.0, via Flickr Creative Commons.
The current methods used to measure creatinine levels in the blood can be costly and prone to error, tending to deliver imprecise estimations with regards to concentration values. A number of research studies have suggested that changes in electrical properties correlate to changes that can be detected in glucose levels. To see if a similar relationship exists with blood creatinine levels, a research team from the University of West Indies decided to investigate. They designed and analyzed a sensor based on a CSRR that could, if effective, better prevent renal failure.
Monitoring CKD by Designing a CSRR-Based Sensor to Measure Blood Creatinine Levels
To build their 3D EM simulation model, the researchers used the COMSOL Multiphysics® software and the add-on RF Module. In the schematic below, the CSRR-based sensor model is shown on the right and the dimensions of the CSRR are highlighted on the left. The dimensions for the resonator are derived from previous research on using CSRR-based sensors to measure relative permittivity (see Ref. 8 in the paper).
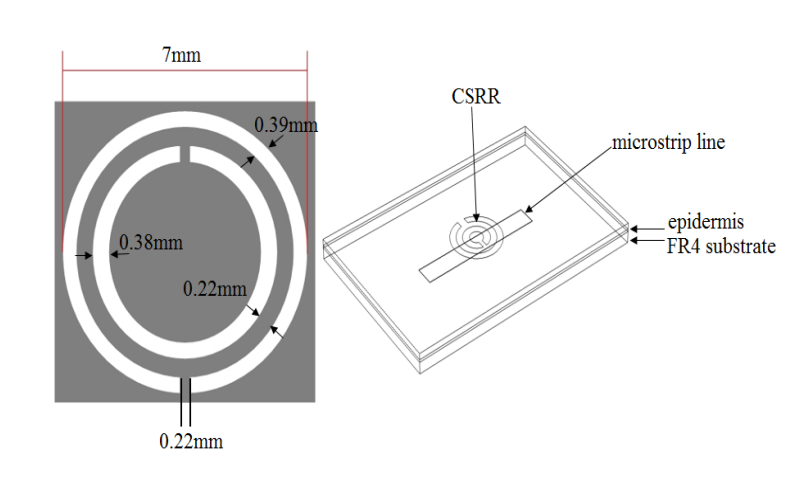
The dimensions of the CSRR (left) and sensor model (right). Images by Z. Ramsaroop, S. Rocke, N. Gayapersad, and J. Persad and taken from their COMSOL Conference 2016 Boston paper.
As illustrated above, the sensor model includes a CSRR and microstrip copper line, the latter of which is excited by an electric field. Human skin (epidermis), with the relevant material properties, is added as the material in contact with the resonator. To simulate a real-world application of the sensor, FR4 is used as the substrate material and the surrounding area is modeled as a perfectly matched layer (PML).
The table below provides an overview of the different dimensions and electrical parameters used in the simulation.
| Component | Shape and Dimensions | Electrical Parameters |
|---|---|---|
| Air |
|
|
| FR4 substrate |
|
|
| Epidermis |
|
|
For the analysis, the microstrip line is excited below the plane of the sensor over the frequency band of 1 to 10 GHz. This frequency band is reflective of values that fall within an acceptable range for medical applications. It also correlates to the requirements for penetration depth into skin tissue when detecting changes in blood permittivity. A parametric sweep is run over a relative permittivity range of 1 to 100 to detect the resonator’s frequency response as a result of changes in relative permittivity. Using such a wide range enabled the researchers to account for all of the possible changes in the dielectric properties of blood that can occur in vivo.
The plots below show the CSRR’s shift in resonance frequency due to the presence of human skin, which acts as a perturbation to the applied electric field on the sensor’s plane. Between the relative permittivity of 5 to 25, a shift in resonance is detected. Within the range of 30 to 100, the resonance frequencies tend to overlap and the reflection coefficient varies in depth as the relative permittivity of the skin changes. The latter trend can be observed at the frequency of 2.65 GHz. This is the resonance frequency for an unloaded CSRR-based sensor with these dimensions when it’s exposed to air.


Comparing the reflected signal and frequency for different relative permittivities. From left to right: 5–20, 45–60, and 85–100. Images by Z. Ramsaroop, S. Rocke, N. Gayapersad, and J. Persad and taken from their COMSOL Conference 2016 Boston paper.
The following plot compares the reflection obtained at the loaded condition with the relative permittivity. The results show good agreement with the values expected by theory. This suggests that the change in reflection with respect to air can be used as a parameter to distinguish between changes in the relative permittivity of blood.
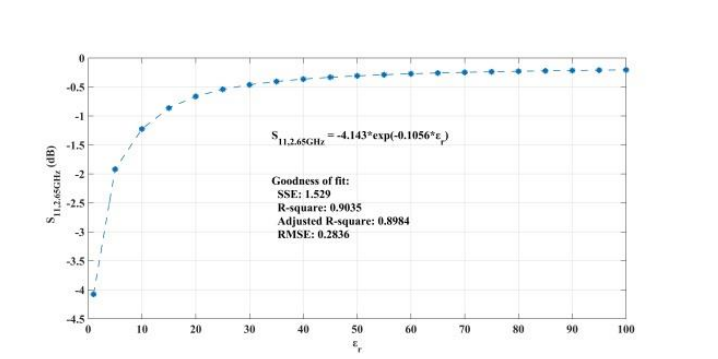
Reflected signal in the loaded condition versus relative permittivity. Image by Z. Ramsaroop, S. Rocke, N. Gayapersad, and J. Persad and taken from their COMSOL Conference 2016 Boston paper.
When addressing relative permittivity, the researchers also took dielectric loss and conductivity into account. The plot below shows good correlation with relative permittivity in a decreasingly exponential form. As such, this parameter can be used to measure changes in blood creatinine levels, which result from changes in relative permittivity due to its relationship with the loss tangent. Comparing the reflected signal in the loaded condition with the loss tangent further iterates the potential of using a CSRR-based sensor to detect blood creatinine concentration levels.


Loss tangent response of the human skin versus relative permittivity (left). Reflection in the loaded condition versus loss tangent response of the human skin (right). Images by Z. Ramsaroop, S. Rocke, N. Gayapersad, and J. Persad and taken from their COMSOL Conference 2016 Boston paper.
Simulation Helps Advance Noninvasive Technology for CKD Monitoring
The development of noninvasive technology offers new hope for reducing treatment costs. CSRR-based sensors have the power to accurately sense changes in the relative permittivity of the human skin and thus measure the blood creatinine levels of CKD patients. Along with their effectiveness, these sensors are a more affordable alternative to current methods of CKD monitoring.
Learn More About Using COMSOL Multiphysics® to Simulate Medical Applications
- Read the full COMSOL Conference paper: “CSRR-Based Microwave Sensor for Measurement of Blood Creatinine Concentration Levels“
- Read a blog post on improving vascular access for the treatment of ESRD patients
- Watch an archived webinar to learn how multiphysics analysis can lead to better medical device designs


Comments (0)