Learning Center
Getting Started With COMSOL Multiphysics®
Results / Contours and Isosurfaces
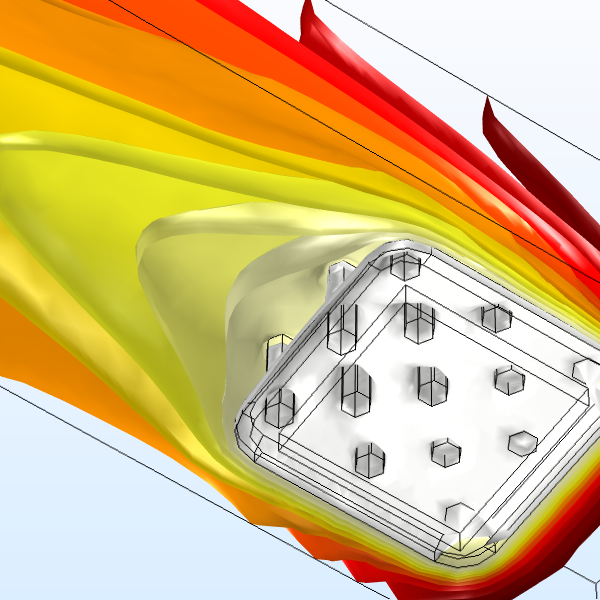
Show results using colored lines or surfaces. Duration: 7:11Contour and Isosurface plots are used in postprocessing to visualize scalar quantities and fields in your simulation results. Contour plots display your results on a series of colored regions or lines. Isosurface plots display your results on a set of colored surfaces where the results quantity is constant.
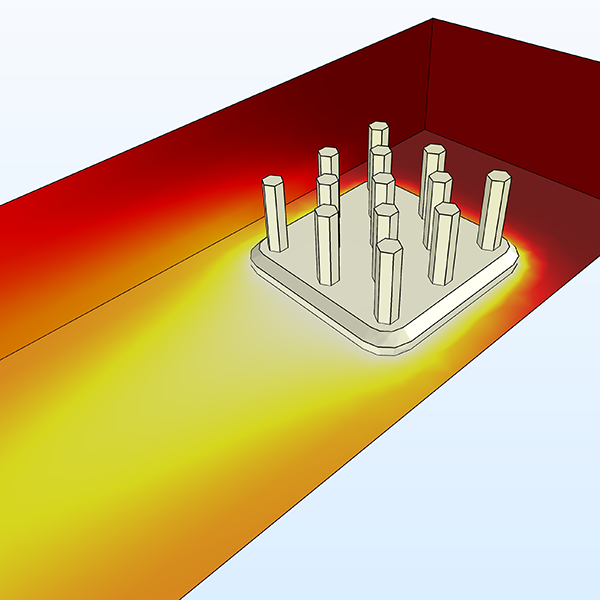
Watch this video to learn how to use these plot types to fit the needs of your COMSOL Multiphysics® model. For the heat sink model shown here, we can add contours or isosurfaces to show the temperature changing with distance from the heat sink.
Video Playlist
Results
Videos: 7
-
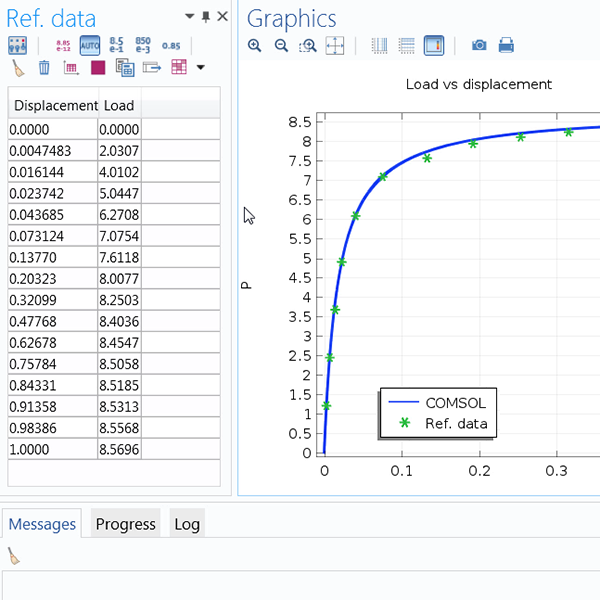
Import Reference Data
Import external data to compare with results.
-
Surface, Volume, Line Plot
Show results on different geometric entity levels.
-
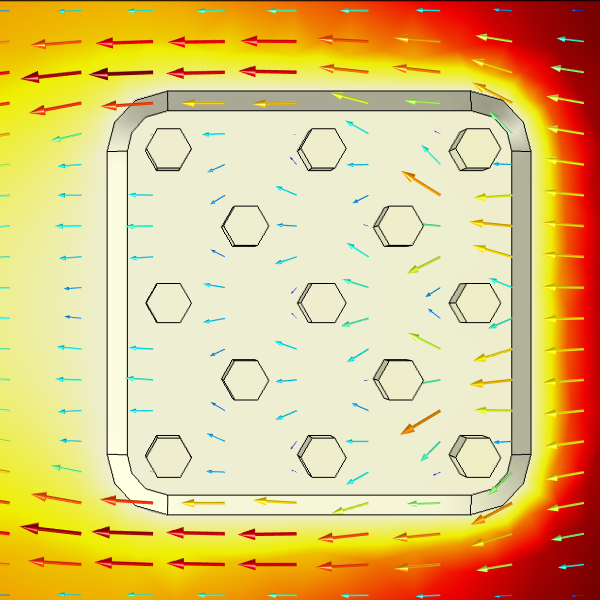
Arrow Plots
Visualize field distributions in your results.
-
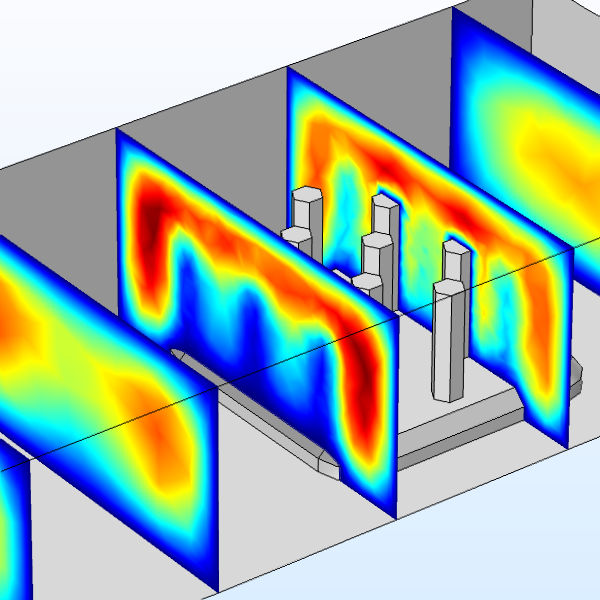
Slice Plots
Display results in cross sections.
-
Contours and Isosurfaces
Show results using colored lines or surfaces.
-
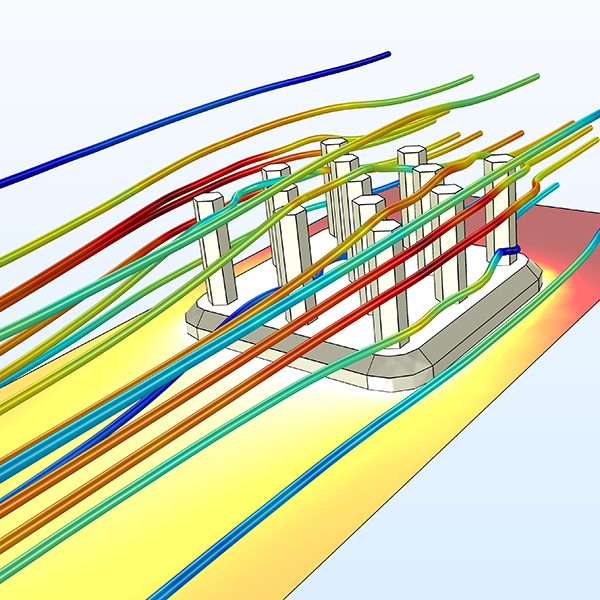
Streamline Plots
Visualize vector quantities in your results.
-
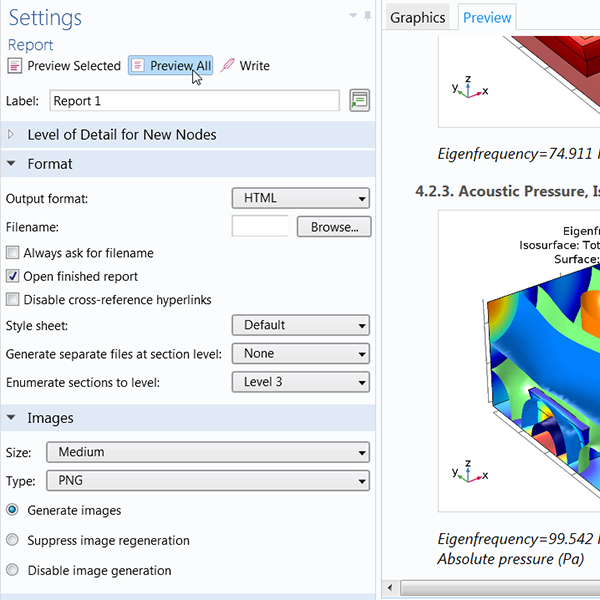
Report Generation
Export reports of your model from the software.
-
Introduction
-
User Interface
-
Geometry
-
Definitions
-
Materials
-
Physics
-
Mesh
-
Study
-
Results
-
Application Builder