

Solar photovoltaic (PV) cells are semiconductor devices that directly convert solar energy into electricity or voltage using the photovoltaic effect. These PV cells are more commonly known as solar cells, or solar panels, and in 2012 they produced roughly 93 terawatt-hours (TWh) of electricity — enough energy to power over 20 million homes. Because the cells must be directly exposed to the sun’s rays, they are housed outdoors where the panels are affected by the elements. Therefore, the cells must not only be optimized to efficiently produce electricity, but must also be able to survive the conditions of their environment over time. This is especially important when designing solar panels for use in a photovoltaic power station (also known as a solar farm, or solar park, where the panels are erected in open fields with no shelter from the wind. In these solar farms, where there are sometimes hundreds of PV cells, the turbulent flow around the panel and the structural displacement that takes place as a result of this flow load must be modeled and analyzed to ensure an optimized solar panel design.

The Erlasee Solar Park, a photovoltaic power station located in Germany.
Solar Power Usage Around the World
Currently, solar power accounts for less than 1% of the world’s power consumption, but this figure has been rising — exponentially — over the past decade. In fact, the use of solar power has increased from a mere 18 gigawatts (GW) in 2000 to 284 GW in 2012. Additionally, from the year 2011 to 2012, photovoltaic power consumption increased by 58%.
One of the main criticisms of solar power is that the photovoltaic industry has been consuming more power than it produces. However, new research from Stanford University suggests that, as of 2012, the energy generated by the world’s PV panels has likely surpassed the energy used in their fabrication. In addition to lower manufacturing and installment costs and the increased efficiency in the conversion of sunlight to electricity, the panels are more robust and durable and therefore need to be replaced less often. The study from Stanford went on to report that if the current growth rate continues, the PV industry will be able to pay off its “energy debt” by the year 2015, and furthermore, that by 2020, 10% of the world’s electricity could be generated by solar power.
Multiphysics simulation can play an important role in the analysis and improvement in the design of PV cells, helping to continue this trend toward more energy efficient and affordable solar power production.
Simulating a Solar Panel in Periodic Flow
When designing solar panels, it is important that all aspects of the design are taken into account, not just the photovoltaic process through which the sun’s energy is captured and converted into electricity. A comprehensive analysis of the system must also include the elements the panel is exposed to, such as the wind loads. To quantify the wind load, i.e. the stresses exerted by the flow on the structure, it is necessary to compute the flow field. Due to the periodic nature of solar farms, they can be modeled by making use of periodic flow.
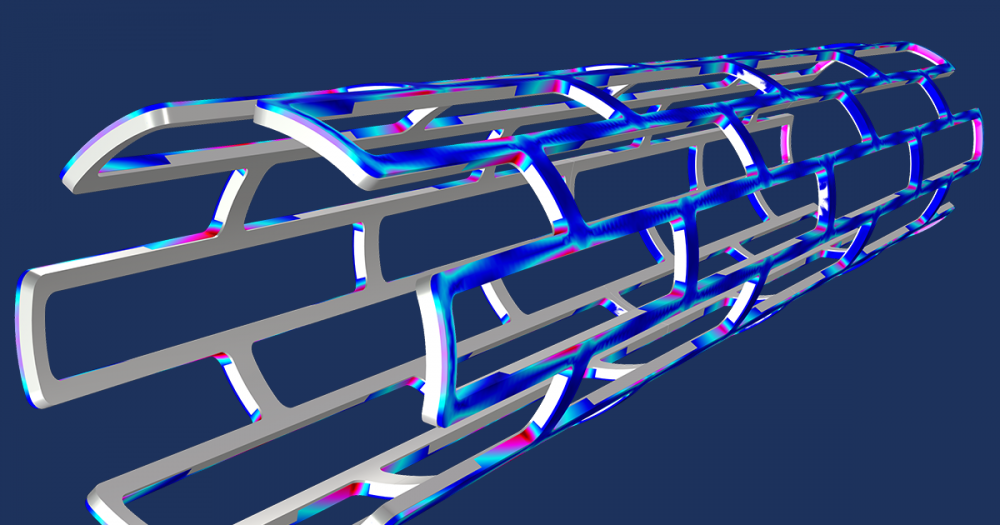
Periodic flow is created when fluid flow is introduced in a geometry that is repetitive in its composition and often made up of many of the same elements. The physical geometry of the system must be repetitive, and this repetition must continue for a certain length of space and time before a periodic flow pattern develops. In a solar farm, where there are often hundreds of identical panel geometries, such a flow pattern commonly occurs. A periodic flow field can be modeled in COMSOL Multiphysics using the CFD Module and a Periodic Flow boundary condition, which joins the outlet flow from one boundary to the inlet of another. When simulating this effect, only the highlighted geometry shown below has to be solved for the flow around the panel in order to determine the structural displacement that occurs due to the fluid load.

Geometry of a solar farm showing a repetitive array that will create periodic flow.
In this geometry, we can assume that there are enough solar panels both upstream and downstream of the highlighted panel for the periodic flow conditions to be applicable. Once the flow stream is modeled, we can further analyze the structural deformation that is caused when the panel is exposed to high winds.
To further reduce the computational load, only half of the highlighted periodic region is modeled by exploiting the symmetry of the geometry:

The geometry of the solar panel to be used for the structural mechanics simulation, showing the included supports.
However, when modeling the fluid flow and periodic flow field, we can save computational time by using a simplified model geometry. In this geometry, the supports located at the back of the panel can be omitted from the simulation, since the supports are small compared to the rest of the geometry and are located in the wake of the flow field. When these components are neglected, the number of required mesh elements is drastically reduced. The geometry that will be used in the fluid-flow portion of the simulation is shown below:

Back-side view of the solar panel geometry used in the fluid-flow simulation.
Flow Field Analysis of the Solar Panel Design
Let’s assume that we would like to analyze the system when it is exposed to winds of 15 m/s, or around 54 km/h (30 mph). According to the Beaufort scale, this can be classified as a moderate wind storm. We can examine the fluid flow around the panel geometry and see how the flow interacts with the panel.
")
|
")
|
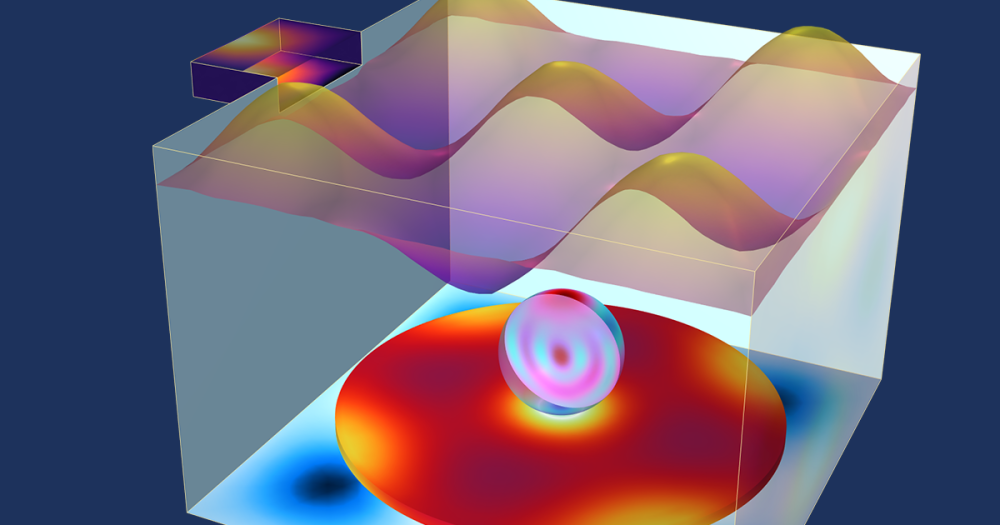
Velocity streamlines, colored by the turbulent kinetic energy normalized by the kinetic energy in the free stream, and velocity components behind the panel.
In the simulation above, a recirculation zone can be seen between the panels in the array. The flow is faster near the top of the panel (red streamlines) and slower in the turbulent flow of the recirculation zone (blue and green streamlines). The upper-right corner of the panel is exposed to the strongest winds and highest pressure. This can be seen in the following model, which shows the surface pressure on the panel:

Surface pressure contours present and in-plane velocity components 6 cm behind the panel. Inlet to outlet pressure difference is 1 Pa.
This model shows the fluid load on the solar panel and demonstrates that the maximum pressure exerted on the solar panel due occurs in the top right corner of the panel and is equal to about 30 Pa.
Structural Displacement of the Solar Panel Design
Next, we use the full solar panel geometry to compute the structural displacement that the fluid load causes in the panel. When we apply the fluid load to the solar panel, we get the displacement shown below:

Structural displacement of the solar panel due to the fluid-flow load.
As the previous fluid flow simulations would suggest, the largest displacement occurs in the upper right-hand corner of the panel. This displacement is rather small, however (only about 0.35 mm). Based off of this small displacement, we can assume that the surrounding solar panels in the array help to shield the panel from the full strength of the 54 km/h wind.
As the PV industry expands and solar panels become more energy efficient and cost effective, the durability of a solar panel design must also increase. In order to determine if the solar panel geometry discussed above could withstand stronger winds, such as what would be experienced in a violent storm with winds of up to 117km/h (73 mph) (as described by the Beaufort scale), additional analyses and optimizations must be carried out. Some of the questions that we might ask about this geometry are: What’s the strongest wind that this panel could withstand? How would this displacement affect the panel’s energy harvesting ability? What improvements could be made? If the PV industry continues to improve exponentially, these questions and others will be asked and answered by solar power engineers from around the globe.
Additional Resources
- Download the model, Solar Panel in Periodic Flow from the model gallery
- Check out some renewable energy statistics from around the world

Comments (3)
Kim Eyckmans
March 28, 2024What an insightful read! This blog beautifully elucidates the significance of efficient solar panel design in advancing the PV industry. The breakdown of key optimization strategies coupled with real-world examples truly enhances understanding. Thanks for sharing such valuable insights!
Cherry He
April 24, 2024Your ability to find beauty in the mundane is a testament to your unique perspective and appreciation for life’s simple pleasures.
solar panel cleaning brush
Cherry He
April 24, 2024Your ability to find beauty in the mundane is a testament to your unique perspective and appreciation for life’s simple pleasures.
https://www.neexgent.com/products/solarpanelcleaningequipment.html