Video Gallery
Video in primo piano
Durata: 8:02
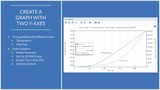
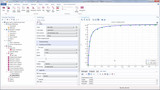
Creating a Graph with Two Y-Axes in COMSOL Multiphysics®
In the COMSOL Multiphysics® software, there might be times when you want to plot multiple values on a single graph. If the values you are plotting have different scales, you can add a ...

Durata: 44:49
Automating Pre- and Postprocessing with Application Builder Features
Watch this archived webinar to learn how to use the Application Builder, a built-in tool in COMSOL Multiphysics®, to automate preprocessing and postprocessing. This will enable you to ...
Durata: 11:12
Create and Export Animations from COMSOL Multiphysics®
Showing visually engaging animations can be extremely valuable when conveying the results of your COMSOL Multiphysics® model. Whether you are showing your results in a presentation, on the ...

Durata: 32:45
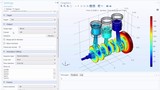
Using Plots to Visualize Results in COMSOL Multiphysics®
Watch this video series to learn how to create some of the most frequently used plot types in COMSOL Multiphysics®. Each video shows a step-by-step demonstration of how to create certain ...
Durata: 1:01:49
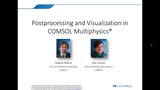
Postprocessing and Visualizing COMSOL Simulation Results
In this archived webinar, learn how to postprocess and analyze your numerical simulation results in COMSOL Multiphysics®. We demonstrate how to evaluate data along lines and surfaces; ...
Durata: 5:39
Using the Graphics Window to Customize Model Visualizations
In COMSOL Multiphysics®, the Graphics window provides you with interactive graphics for the geometry, mesh, and results of your model. In addition, the Graphics window toolbar provides you ...
Durata: 5:02
How to Use Streamline Plots to Visualize Your Results
Streamline plots are a postprocessing tool in COMSOL Multiphysics® that can be applied to the results of 2D and 3D models. You can use a Streamline plot to display a vector quantity, which is ...
Durata: 7:11
How to Use Contour and Isosurface Plots to Visualize Results
Contour and Isosurface plots are used in postprocessing to visualize scalar quantities and fields in your simulation results. Contour plots display your results on a series of colored regions or ...
Durata: 6:31
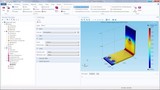
How to Use Slice Plots to Visualize Your Results
Slice plots are a postprocessing tool that can be applied to your COMSOL Multiphysics simulations that are modeled in 3D. You can use a Slice plot to display a quantity on one or more cross ...

Durata: 5:05
How to Use Arrow Plots to Visualize Your Results
Arrow plots are a powerful postprocessing tool used to visualize field distributions in COMSOL Multiphysics®. This is useful for fluid flow, electricity and magnetism, chemical, and heat ...
Durata: 8:06
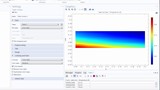
How to Use Surface, Volume, and Line Plots to Visualize Your Results
COMSOL Multiphysics® contains many tools for postprocessing and visualizing your simulation results. Among the many plot types available are Surface, Line, and Volume plots. Surface plots are used ...
Durata: 3:22
How to Import Results Data into COMSOL Multiphysics
When a simulation has numerous data points, you can compare your results with reference or experimental data directly within the COMSOL Multiphysics graphical user interface. In this video, we ...
Durata: 3:53
Postprocessing the Results from a Parametric Sweep
After running a COMSOL Multiphysics simulation that yields multiple results, there are specific ways to postprocess the data. Using a simple parametric sweep study, we show you how to tabulate your ...
Durata: 1:50
Creating and Exporting Model Reports in COMSOL Multiphysics®
In COMSOL Multiphysics®, you can use the COMSOL Report Generator to create a comprehensive report of an entire model and this tutorial video demonstrates how. Your report can include all ...
Durata: 1:02
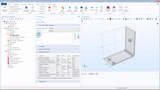
Visualize a Model's Mesh and Solution in One Plot
This tutorial video shows you how you can visualize any model's mesh and solution in a single plot in COMSOL Multiphysics®. Note that this capability is available for any results that are ...
Durata: 8:02
Creating a Graph with Two Y-Axes in COMSOL Multiphysics®
In the COMSOL Multiphysics® software, there might be times when you want to plot multiple values on a single graph. If the values you are plotting have different scales, you can add a second y-axis to ...
Durata: 44:49
Automating Pre- and Postprocessing with Application Builder Features
Watch this archived webinar to learn how to use the Application Builder, a built-in tool in COMSOL Multiphysics®, to automate preprocessing and postprocessing. This will enable you to efficiently build your ...
Durata: 11:12
Create and Export Animations from COMSOL Multiphysics®
Showing visually engaging animations can be extremely valuable when conveying the results of your COMSOL Multiphysics® model. Whether you are showing your results in a presentation, on the web, or as a ...
Durata: 32:45
Using Plots to Visualize Results in COMSOL Multiphysics®
Watch this video series to learn how to create some of the most frequently used plot types in COMSOL Multiphysics®. Each video shows a step-by-step demonstration of how to create certain plot types and the ...
Durata: 1:01:49
Postprocessing and Visualizing COMSOL Simulation Results
In this archived webinar, learn how to postprocess and analyze your numerical simulation results in COMSOL Multiphysics®. We demonstrate how to evaluate data along lines and surfaces; compute derived ...
Durata: 5:39
Using the Graphics Window to Customize Model Visualizations
In COMSOL Multiphysics®, the Graphics window provides you with interactive graphics for the geometry, mesh, and results of your model. In addition, the Graphics window toolbar provides you with the ...
Durata: 5:02
How to Use Streamline Plots to Visualize Your Results
Streamline plots are a postprocessing tool in COMSOL Multiphysics® that can be applied to the results of 2D and 3D models. You can use a Streamline plot to display a vector quantity, which is ...
Durata: 7:11
How to Use Contour and Isosurface Plots to Visualize Results
Contour and Isosurface plots are used in postprocessing to visualize scalar quantities and fields in your simulation results. Contour plots display your results on a series of colored regions or ...
Durata: 6:31
How to Use Slice Plots to Visualize Your Results
Slice plots are a postprocessing tool that can be applied to your COMSOL Multiphysics simulations that are modeled in 3D. You can use a Slice plot to display a quantity on one or more cross ...
Durata: 5:05
How to Use Arrow Plots to Visualize Your Results
Arrow plots are a powerful postprocessing tool used to visualize field distributions in COMSOL Multiphysics®. This is useful for fluid flow, electricity and magnetism, chemical, and heat transfer ...
Durata: 8:06
How to Use Surface, Volume, and Line Plots to Visualize Your Results
COMSOL Multiphysics® contains many tools for postprocessing and visualizing your simulation results. Among the many plot types available are Surface, Line, and Volume plots.
Surface plots are used ...
Durata: 3:22
How to Import Results Data into COMSOL Multiphysics
When a simulation has numerous data points, you can compare your results with reference or experimental data directly within the COMSOL Multiphysics graphical user interface. In this video, we ...
Durata: 3:53
Postprocessing the Results from a Parametric Sweep
After running a COMSOL Multiphysics simulation that yields multiple results, there are specific ways to postprocess the data. Using a simple parametric sweep study, we show you how to tabulate your ...
Durata: 1:50
Creating and Exporting Model Reports in COMSOL Multiphysics®
In COMSOL Multiphysics®, you can use the COMSOL Report Generator to create a comprehensive report of an entire model and this tutorial video demonstrates how.
Your report can include all of the settings ...
Durata: 1:02
Visualize a Model's Mesh and Solution in One Plot
This tutorial video shows you how you can visualize any model's mesh and solution in a single plot in COMSOL Multiphysics®. Note that this capability is available for any results that are contained in 3D or ...